The Amazon Rainforest is one of the largest ecosystems on Earth, spanning an area of about 2.7 million square miles, of which 2.3 million is rainforest. Its boundaries encompass nine Latin American countries and approximately 3,000 indigenous territories. The majority of the land lies in Brazil, which accounts for 60% of the territory. However, despite the forest's crucial role in mitigating global climate change, its area has suffered significant deforestation since the 1970s, risking irreversible environmental damage.
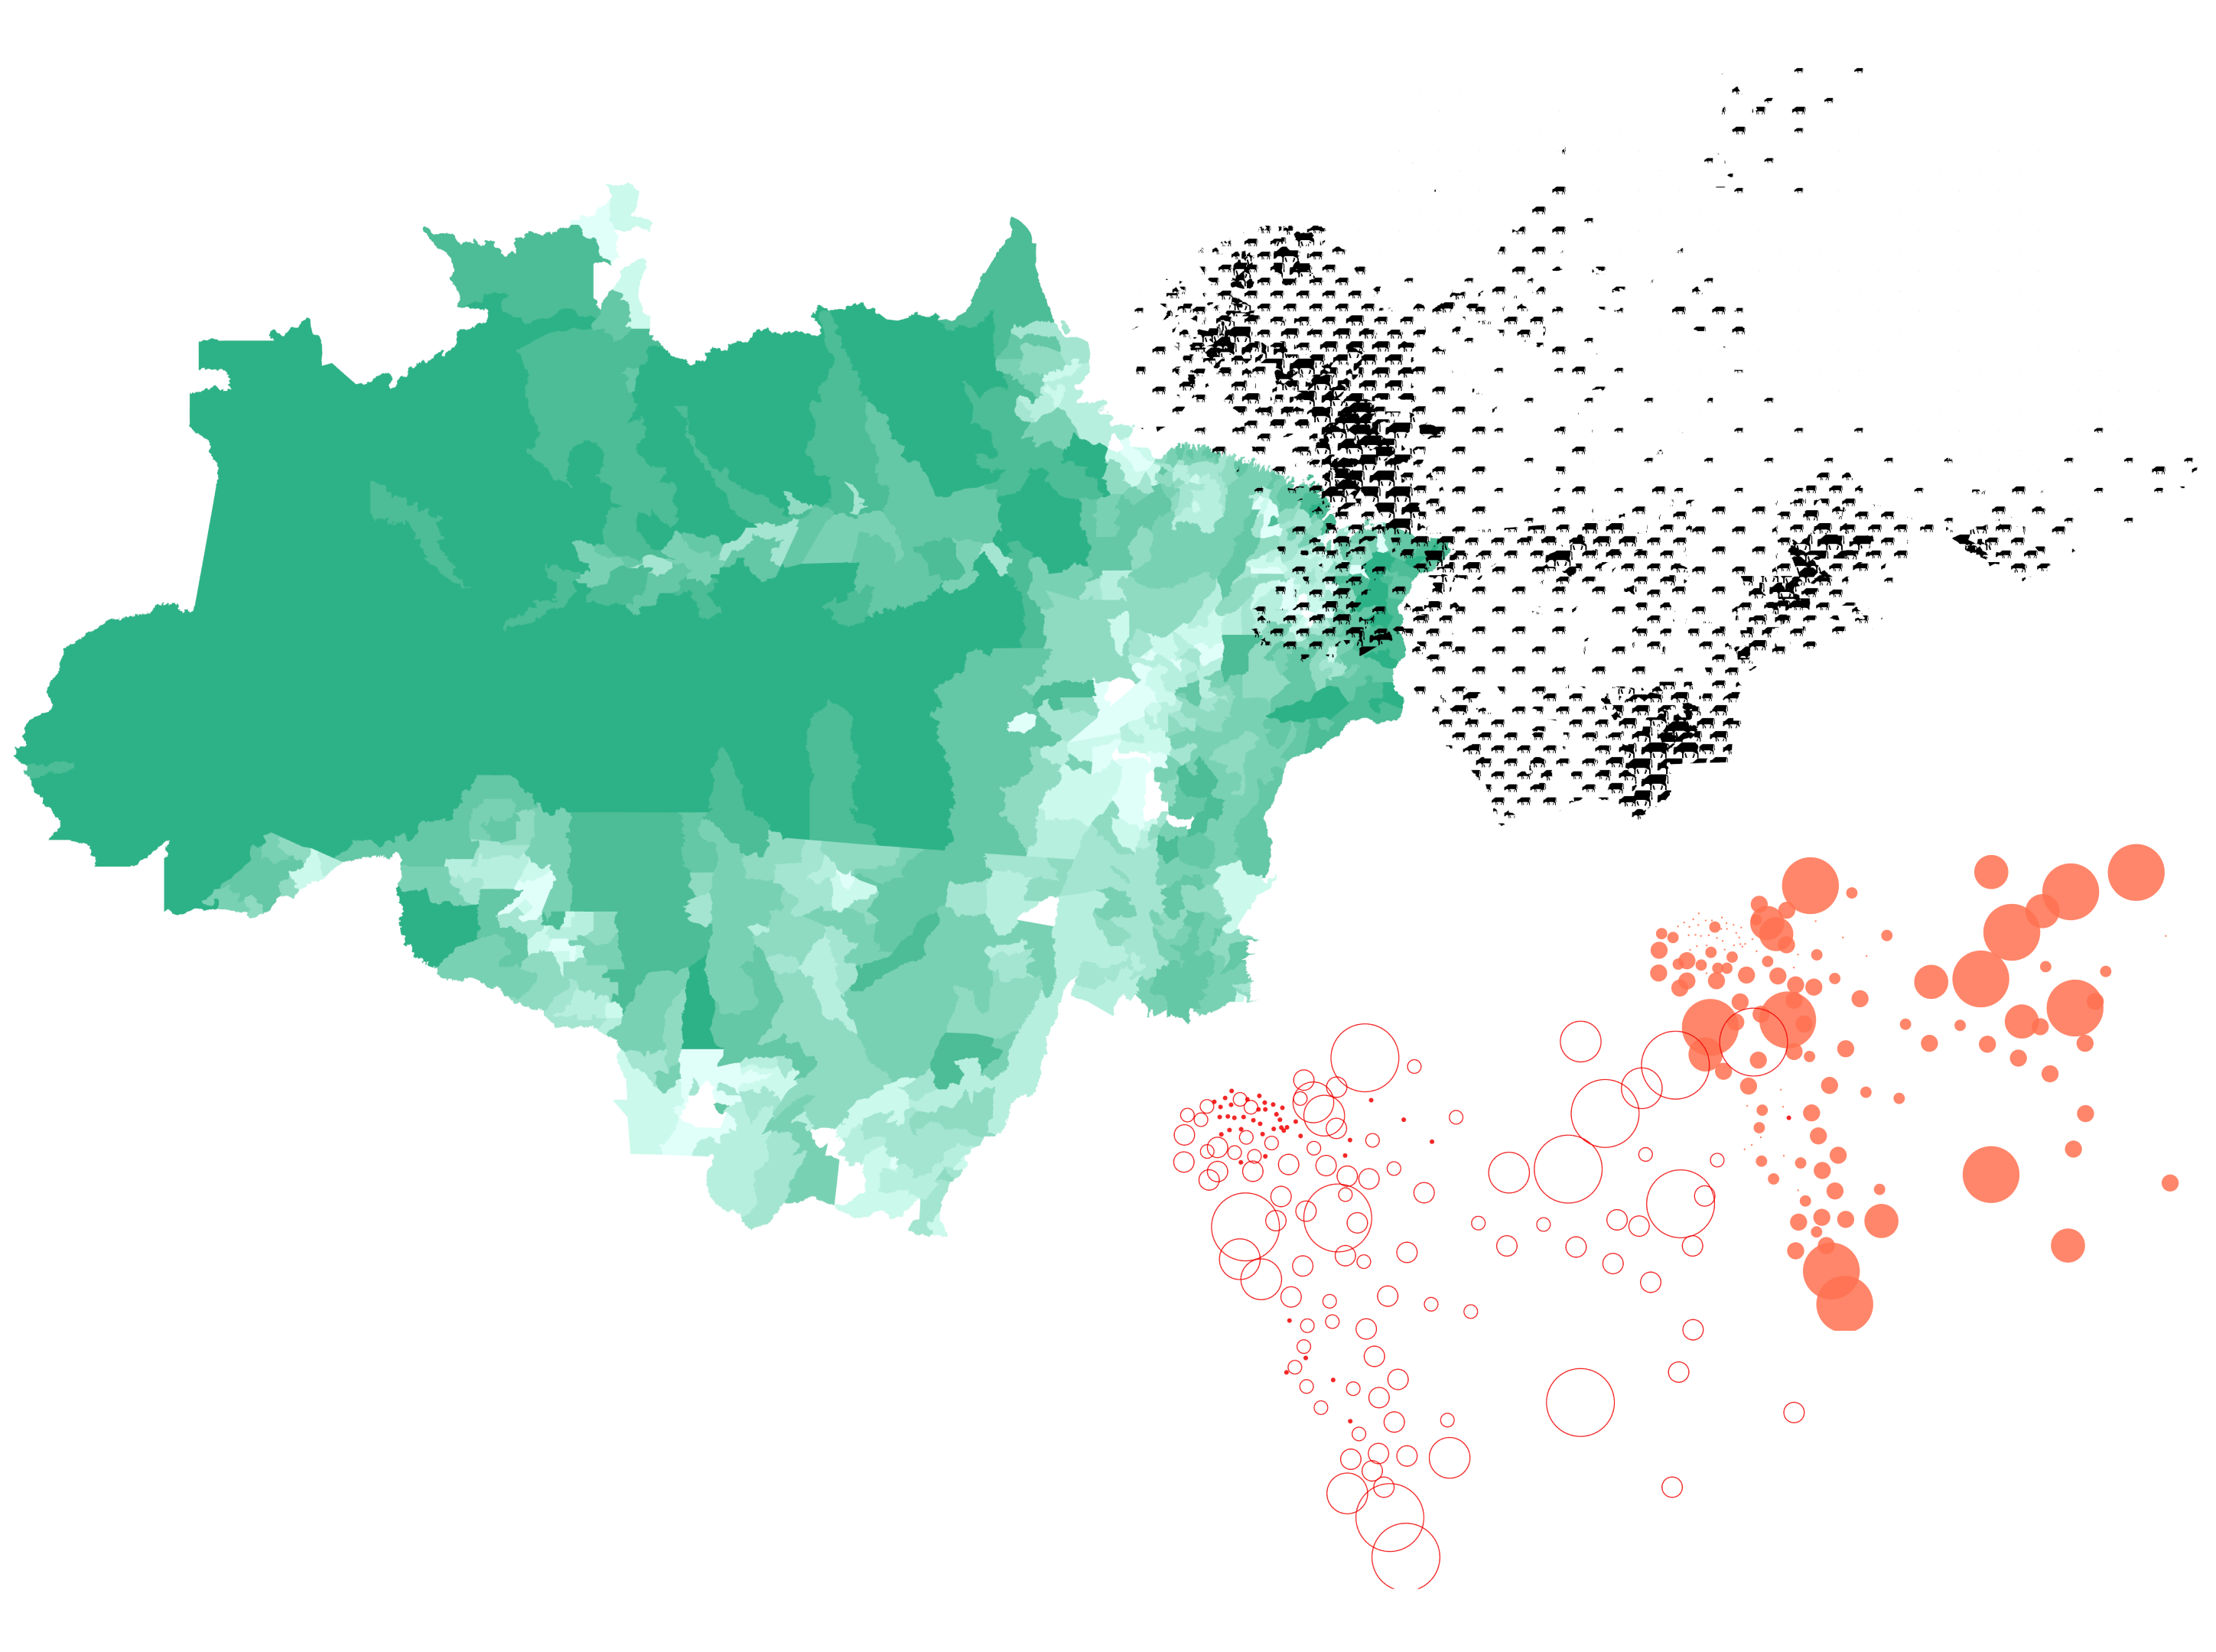
The satellite data behind this project maps each land use by its precise location, so points in the same category are scattered across the region rather than grouped, making overall proportions hard to read at a glance. To surface those proportions, the raw tabular data was cleaned and restructured in Python, then translated into the graphical layers shown here: a forest gradient and a cattle pasture layer, later combined into the full map.
The satellite data behind this project maps each land use by its precise location, so points in the same category are scattered across the region rather than grouped, making overall proportions hard to read at a glance. To surface those proportions, the raw tabular data was cleaned and restructured in Python, then translated into the graphical layers shown here: a forest gradient and a cattle pasture layer, later combined into the full map.
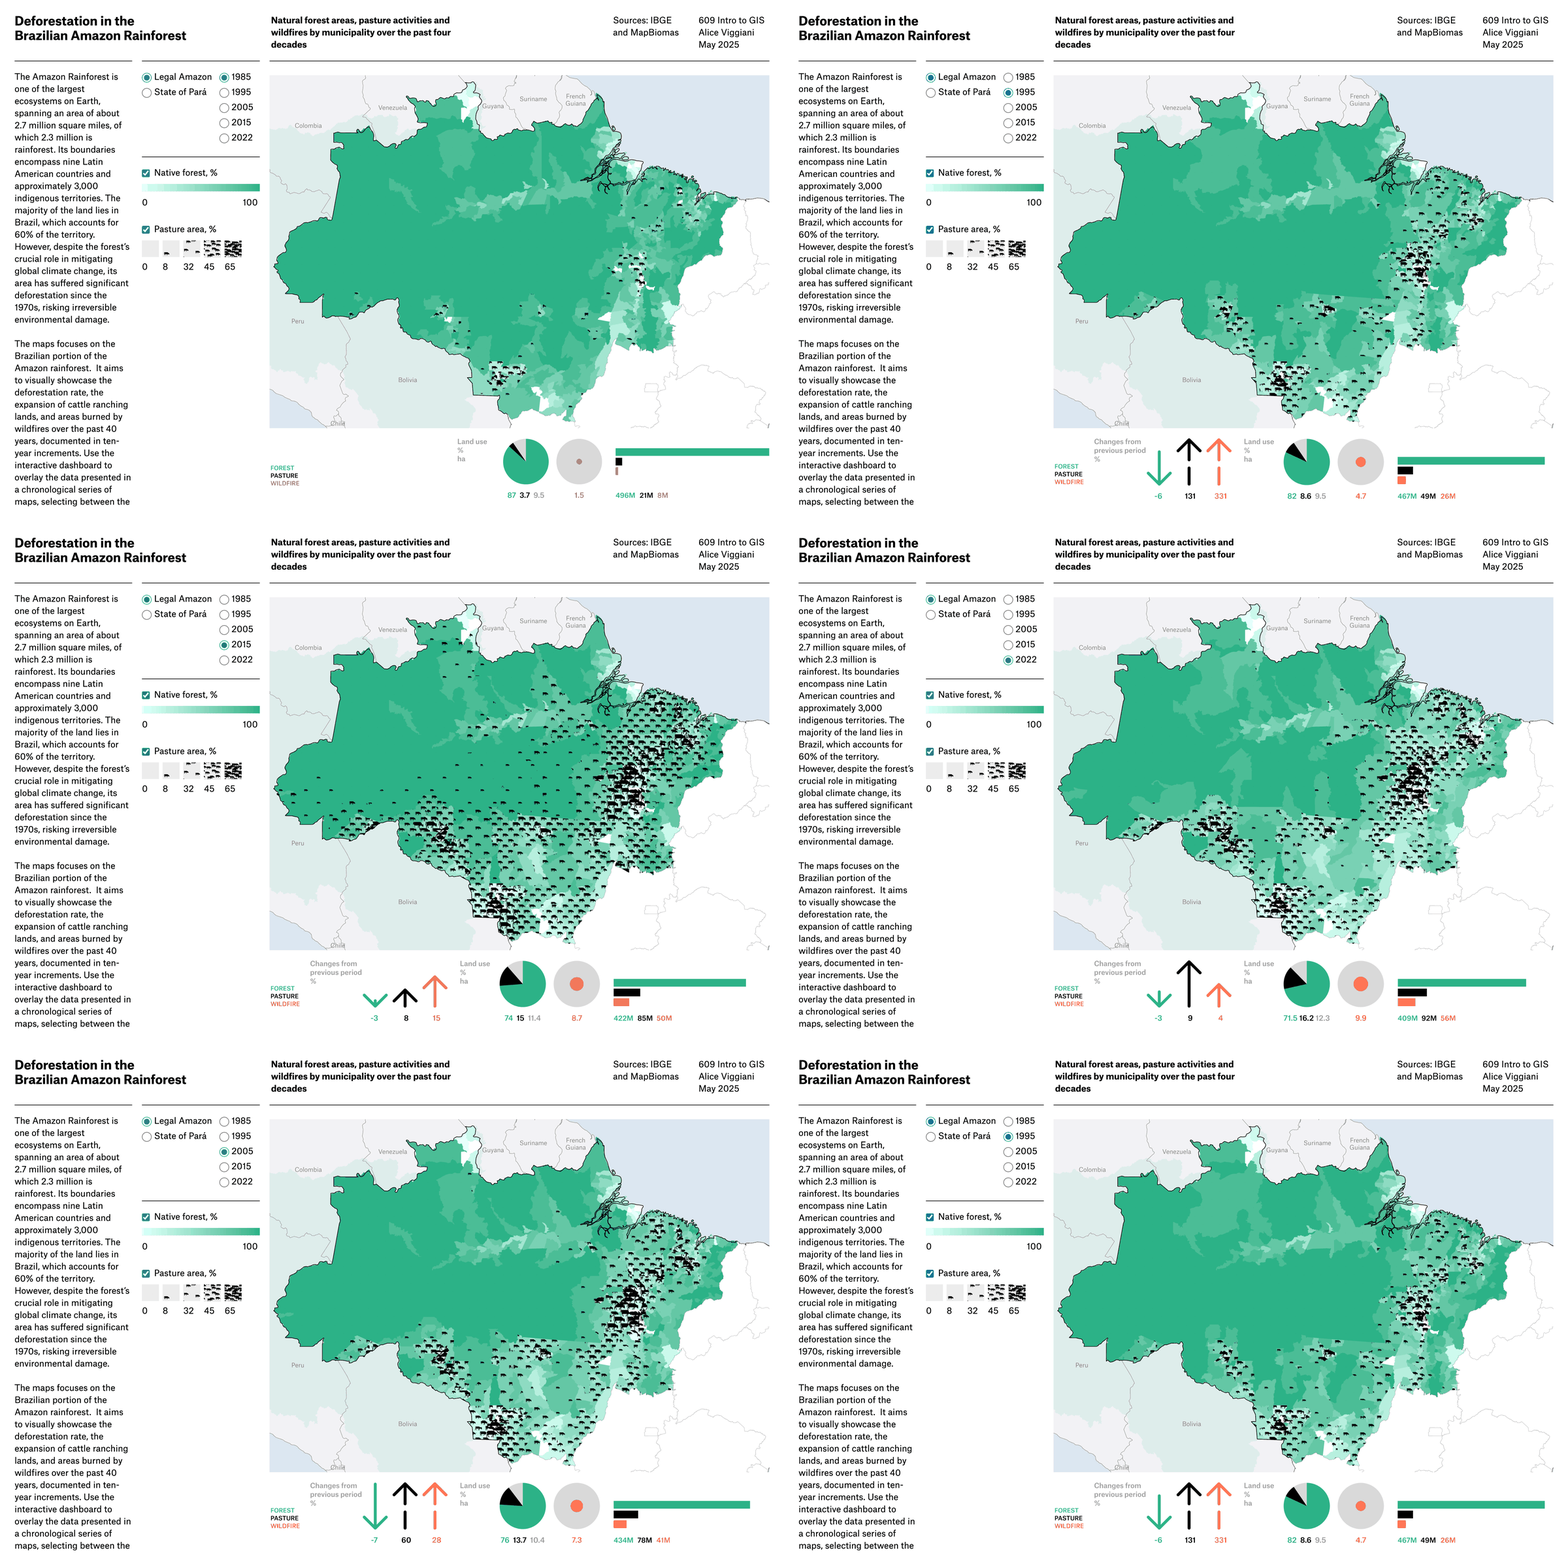
The study seeks to visually showcase the deforestation rate, the expansion of cattle ranching lands, and areas burned by wildfires over the past 40 years, documented in ten-year increments. The data is presented as an interactive, chronological series of maps that overlay all three variables, letting you check whether they move together across the Brazilian Amazon.
The resulting map runs from 1985 to 2022 in ten-year steps, relating the percentage of native forest to the growth of pasture land in the Legal Amazon, at the municipality level. A gradient of green marks forest cover, while pasture (land used for raising cattle and sheep) is shown as a density of cow icons, chosen for how quickly it reads against the green.
The resulting map runs from 1985 to 2022 in ten-year steps, relating the percentage of native forest to the growth of pasture land in the Legal Amazon, at the municipality level. A gradient of green marks forest cover, while pasture (land used for raising cattle and sheep) is shown as a density of cow icons, chosen for how quickly it reads against the green.

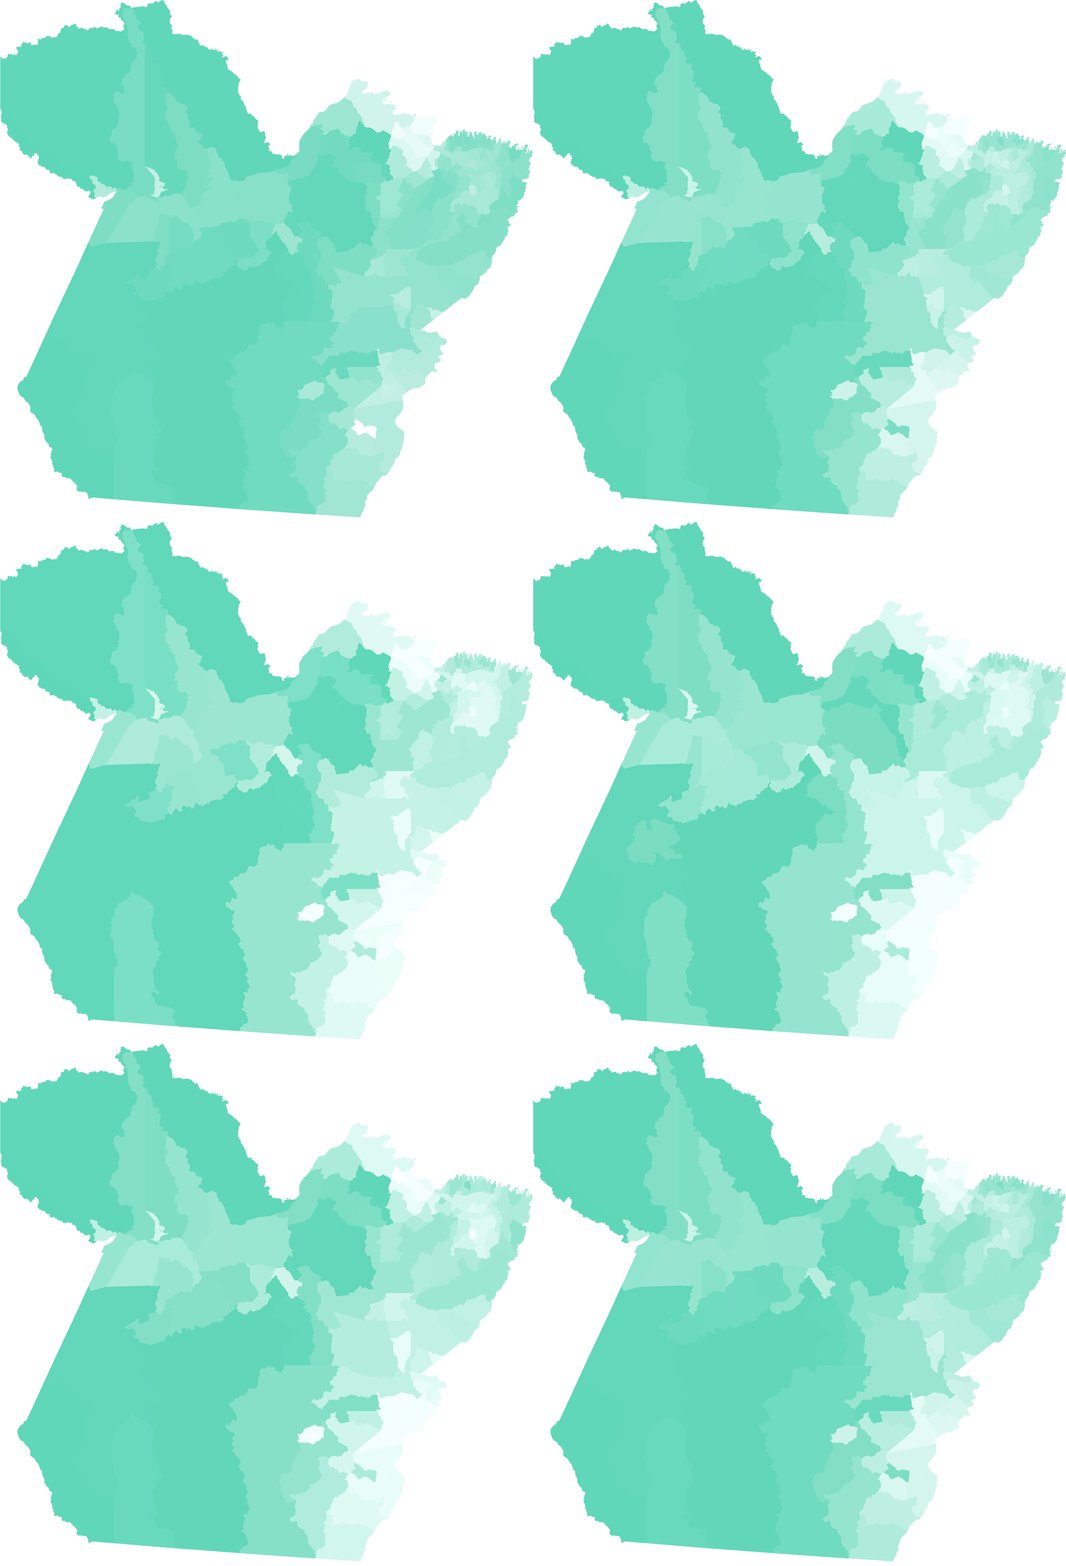
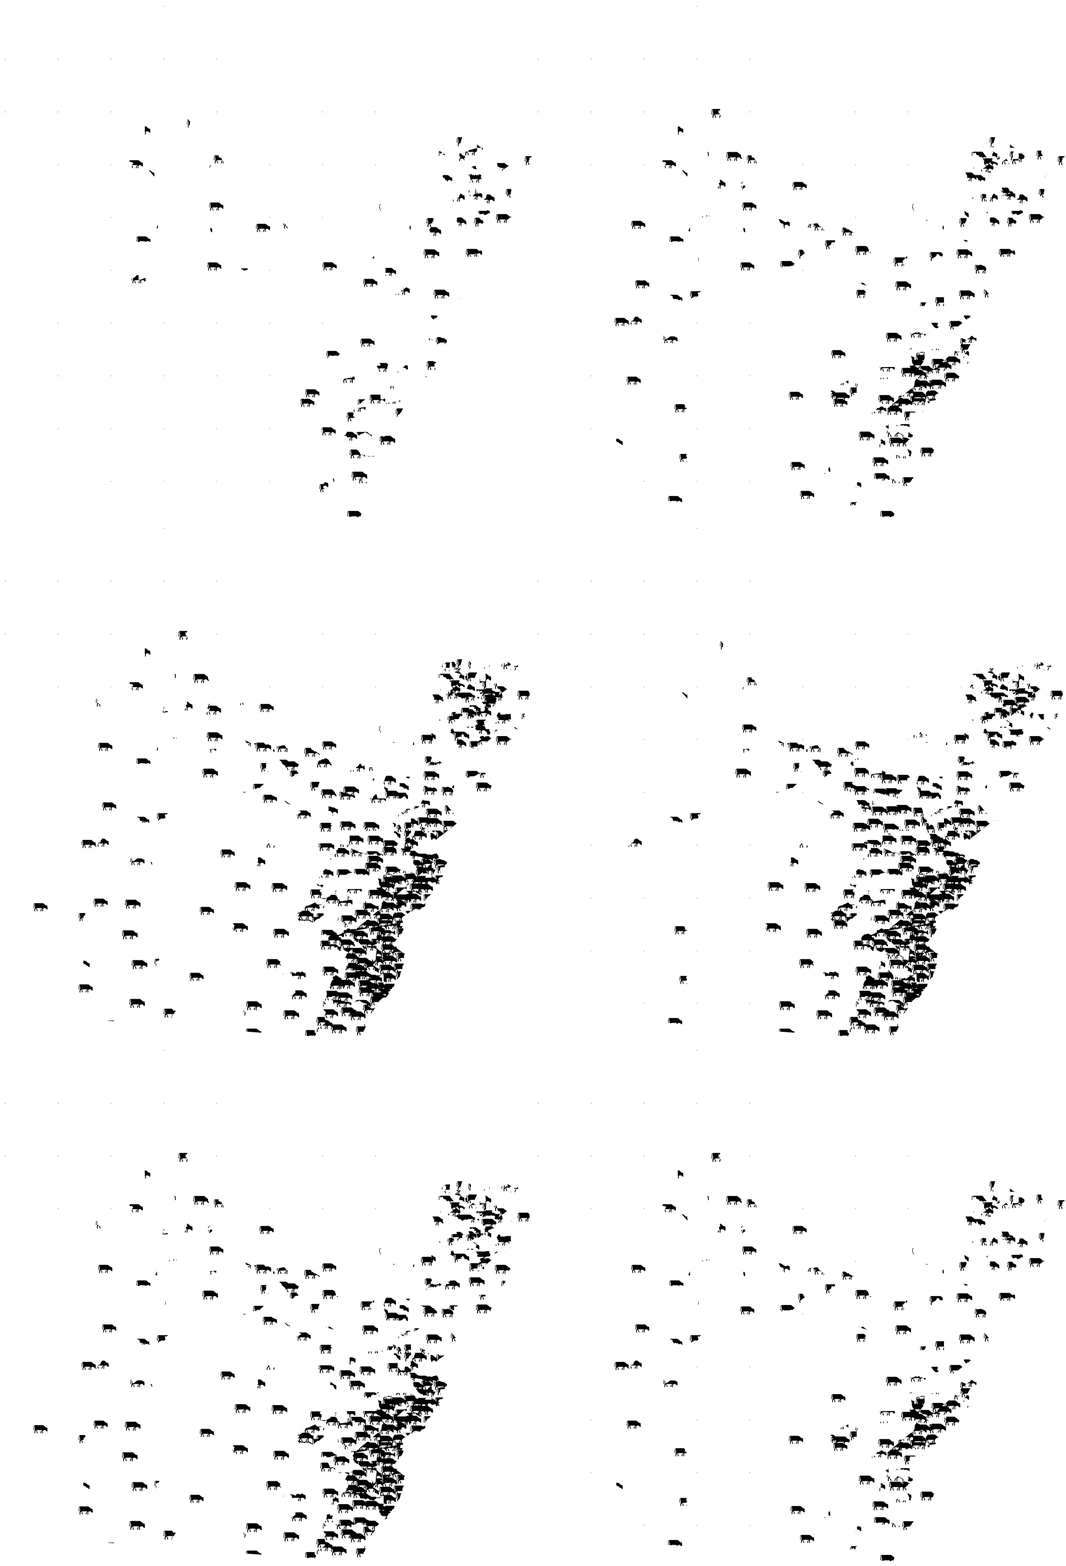
To bring the wildfires as a third variable without crowding the forest and pasture layers, this section isolates each one into its own animation, shown side by side. Pará, the second-largest state within the Amazon rainforest, mixes untouched natural areas with dense anthropic land use, making it a representative sample of the wider region.
Burned areas appear as a pair of orange circles: solid for the total area burned that year, outlined for the ten-year mean leading up to it, since a single year's fires say less than a sustained pattern does. Set next to the forest and pasture animations, it becomes possible to compare how fast each variable is actually changing, rather than reading one combined, harder-to-parse map.
Burned areas appear as a pair of orange circles: solid for the total area burned that year, outlined for the ten-year mean leading up to it, since a single year's fires say less than a sustained pattern does. Set next to the forest and pasture animations, it becomes possible to compare how fast each variable is actually changing, rather than reading one combined, harder-to-parse map.
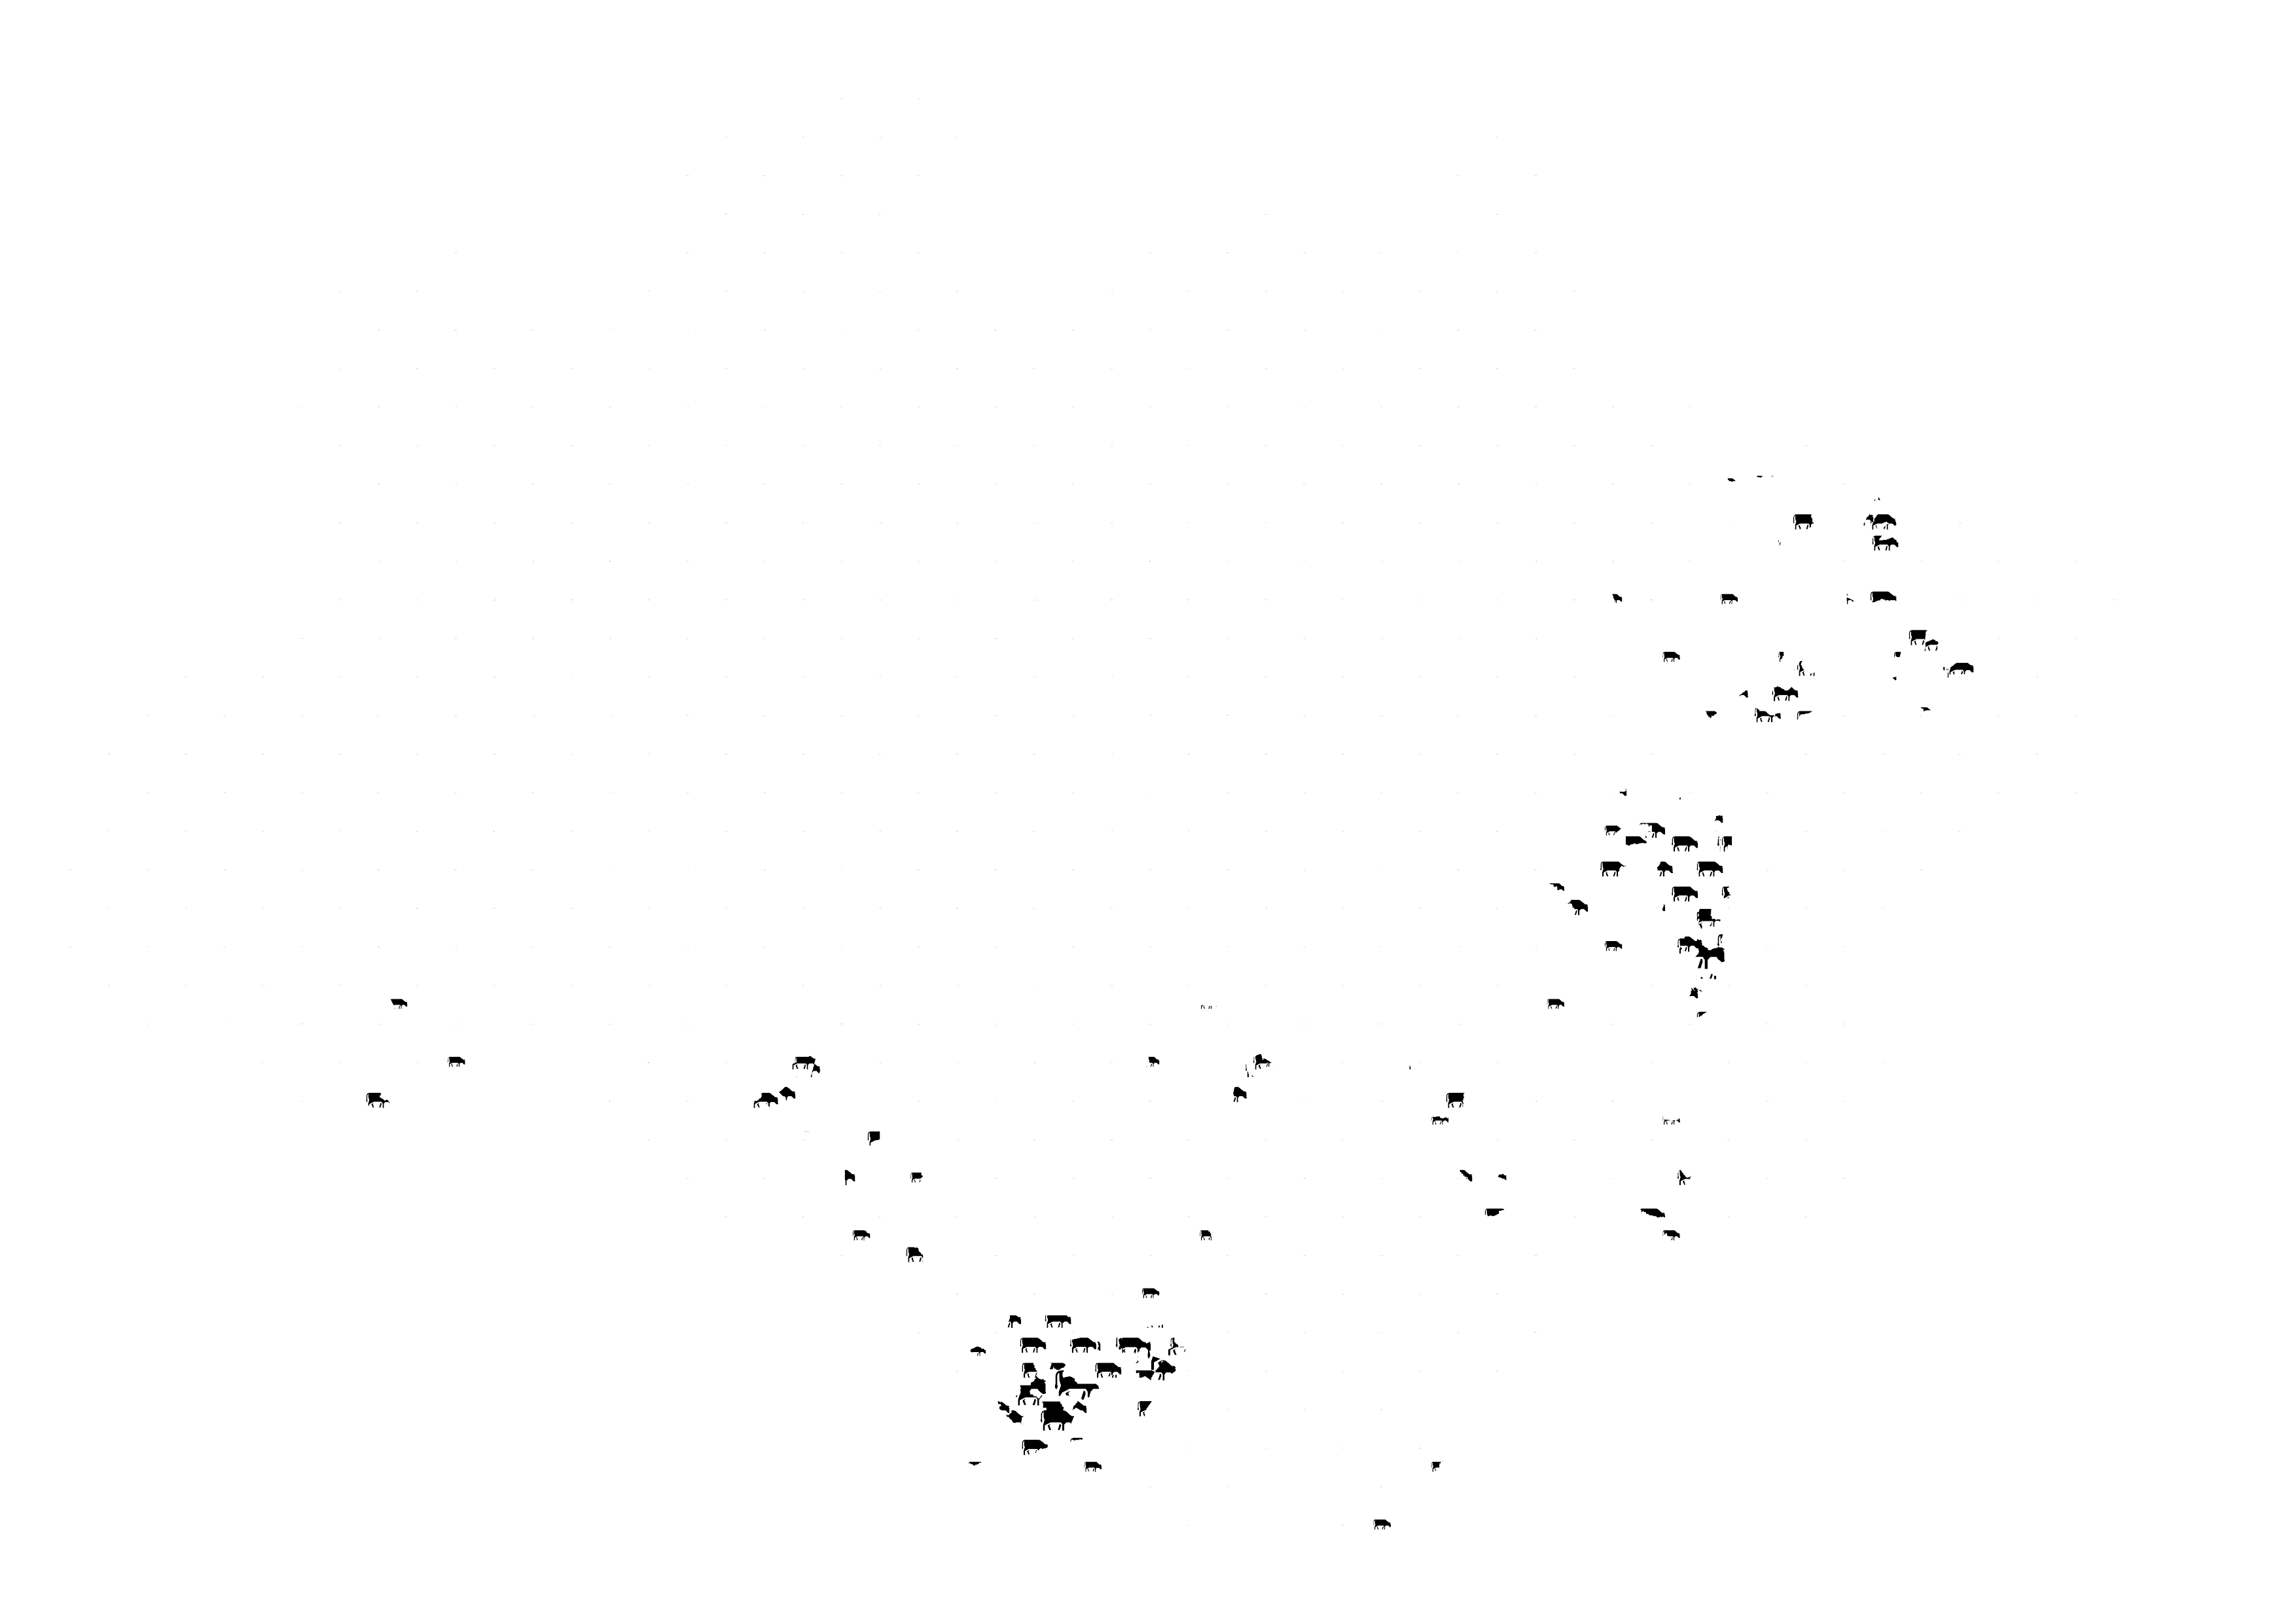
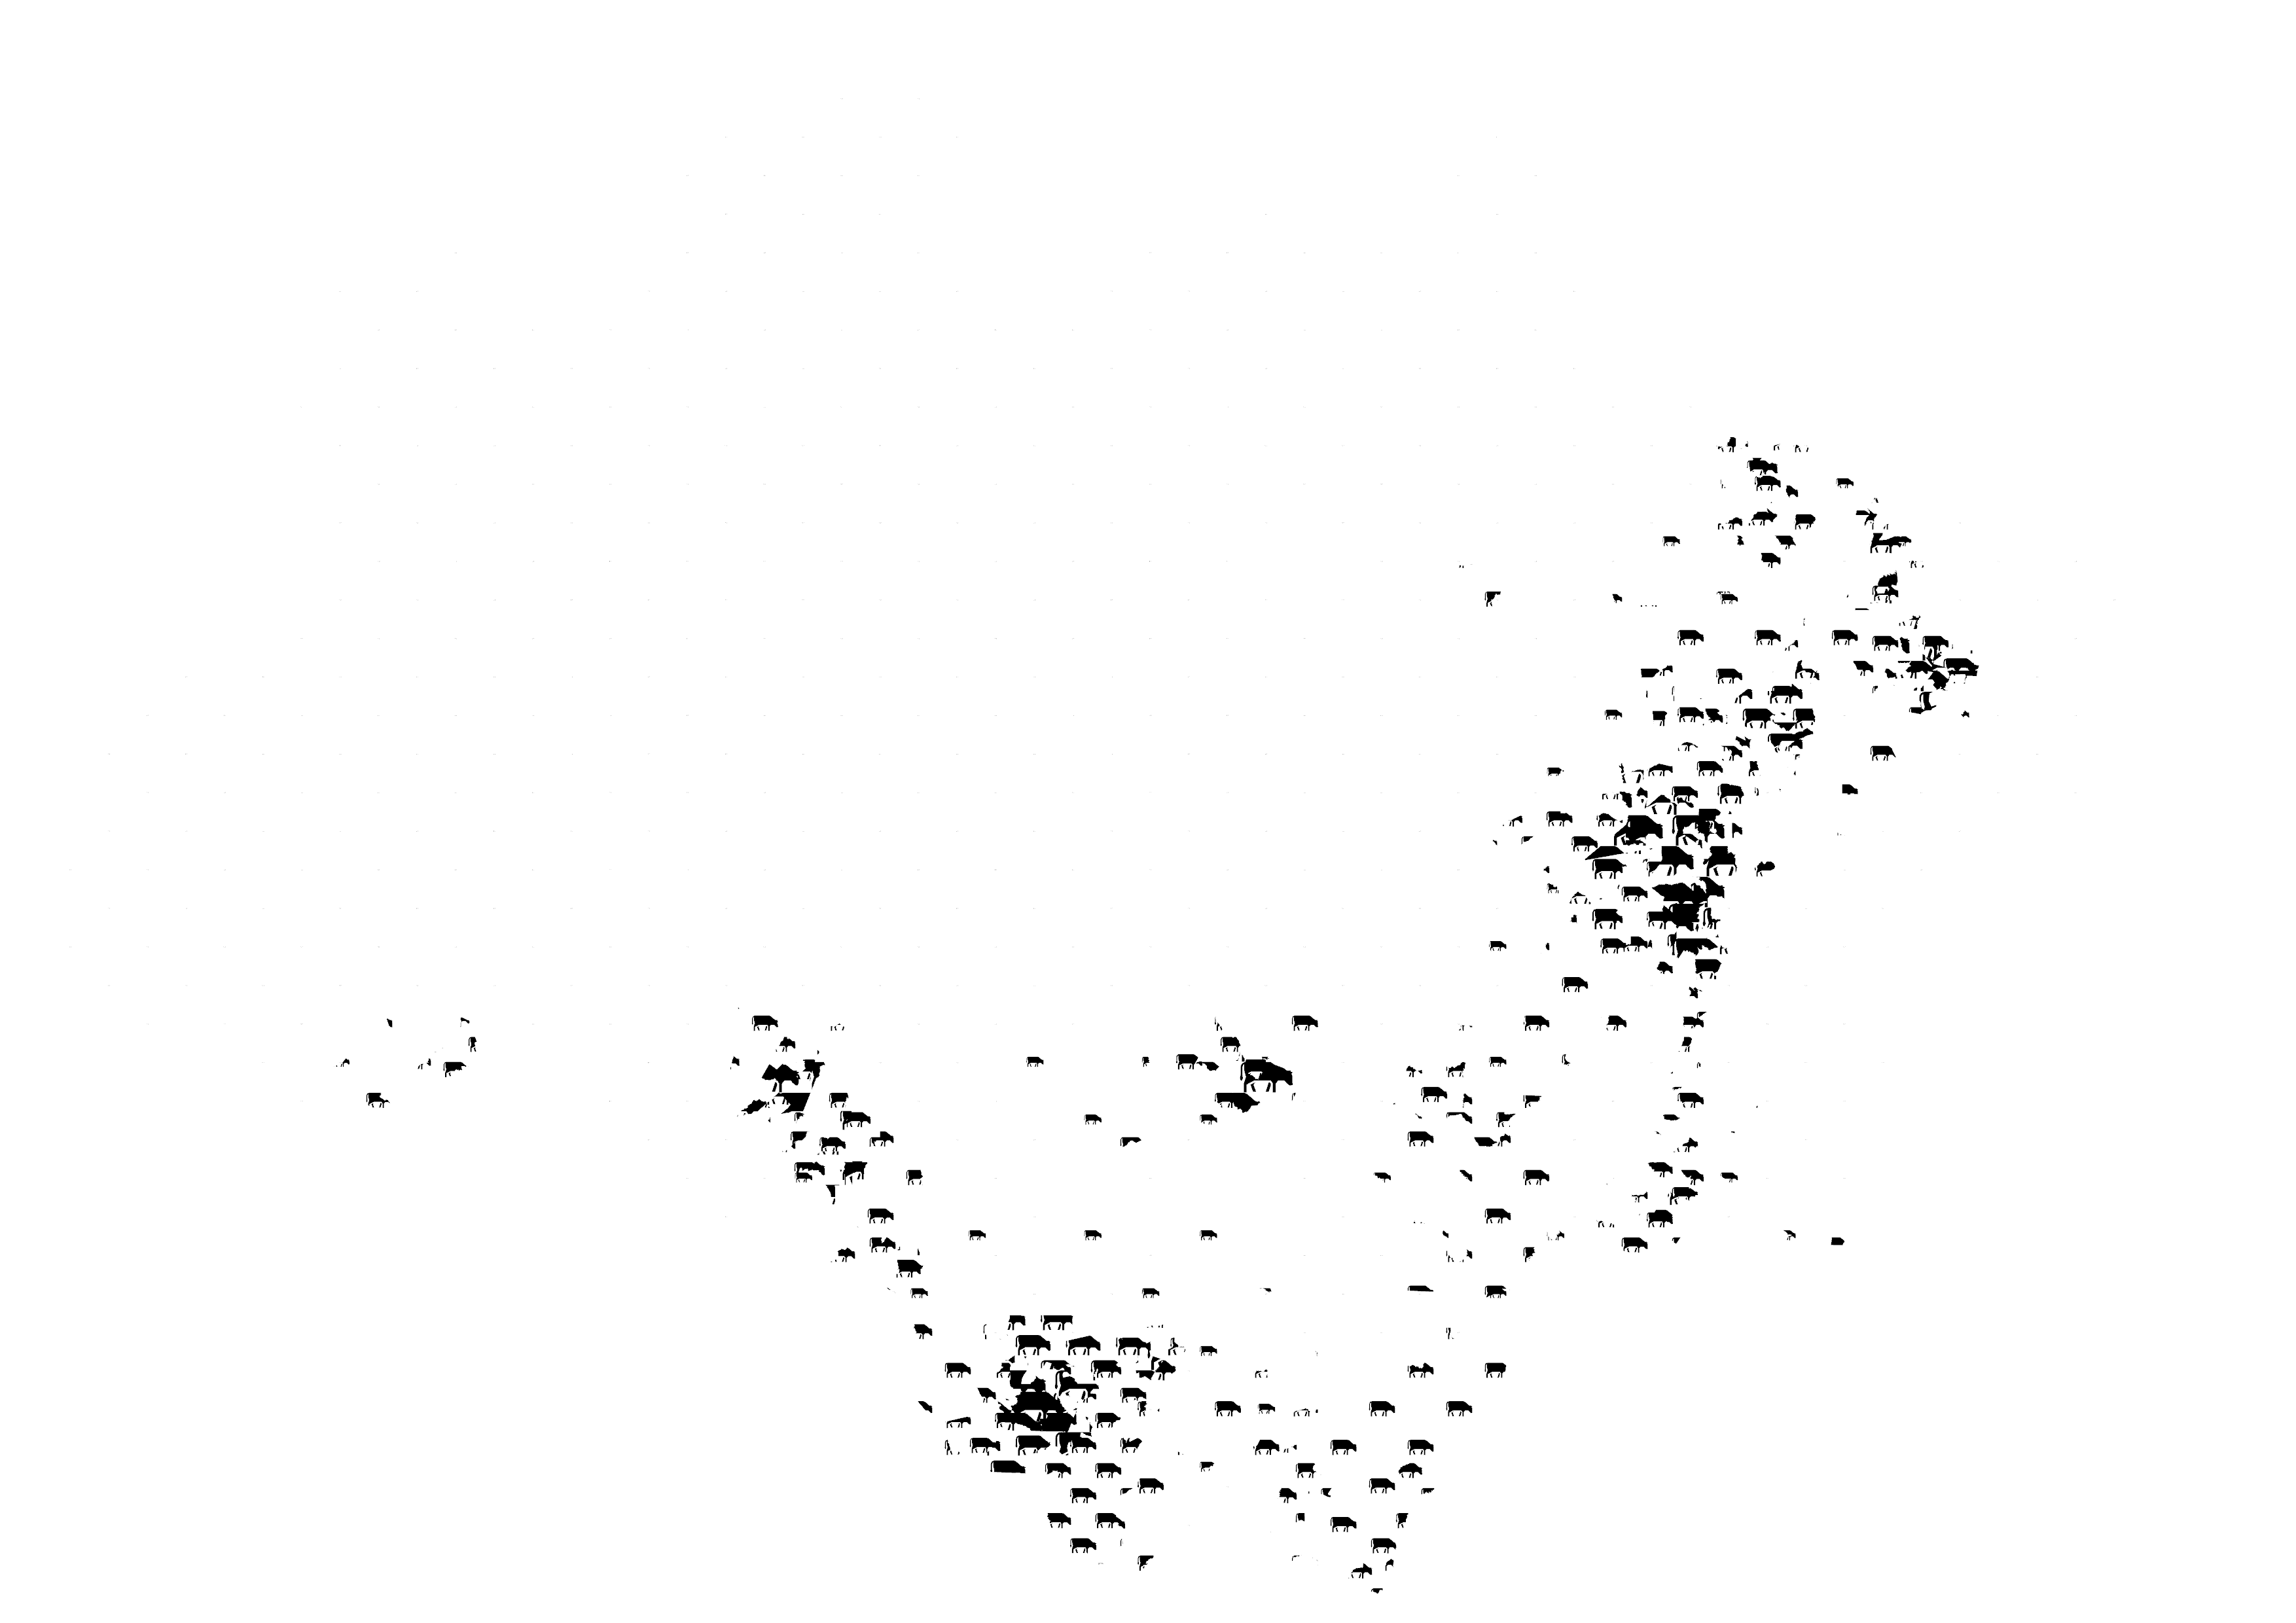
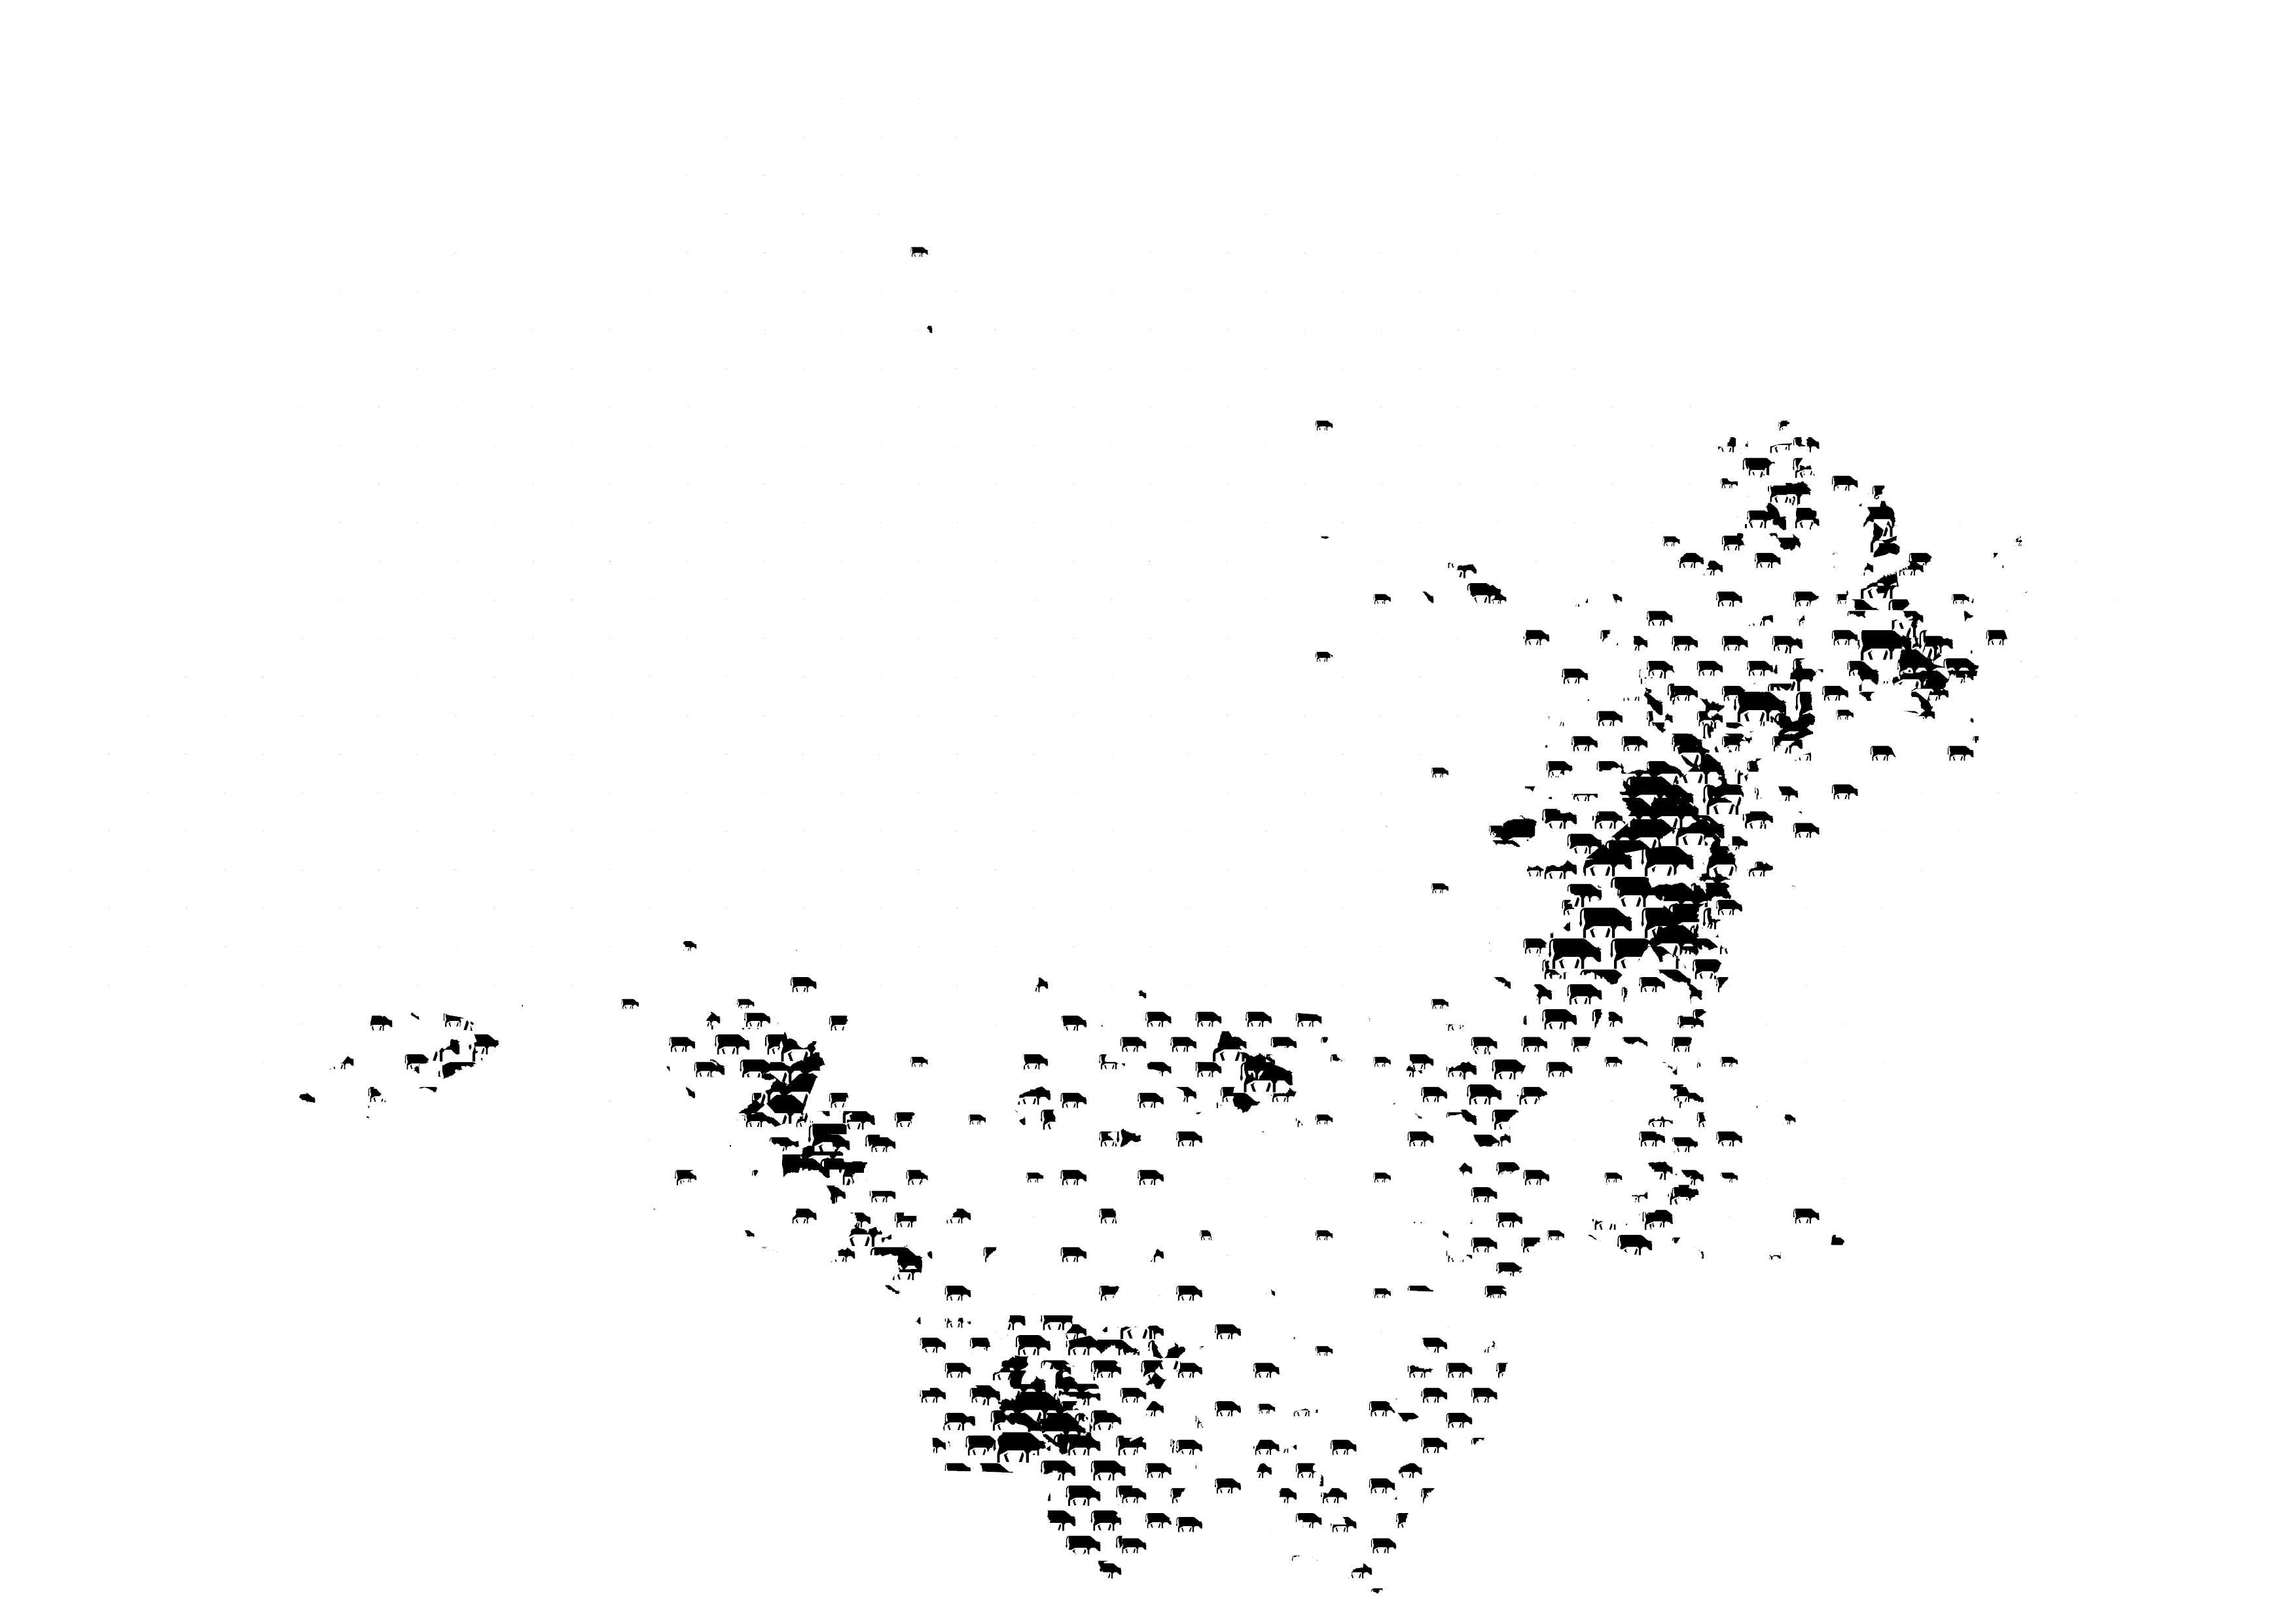
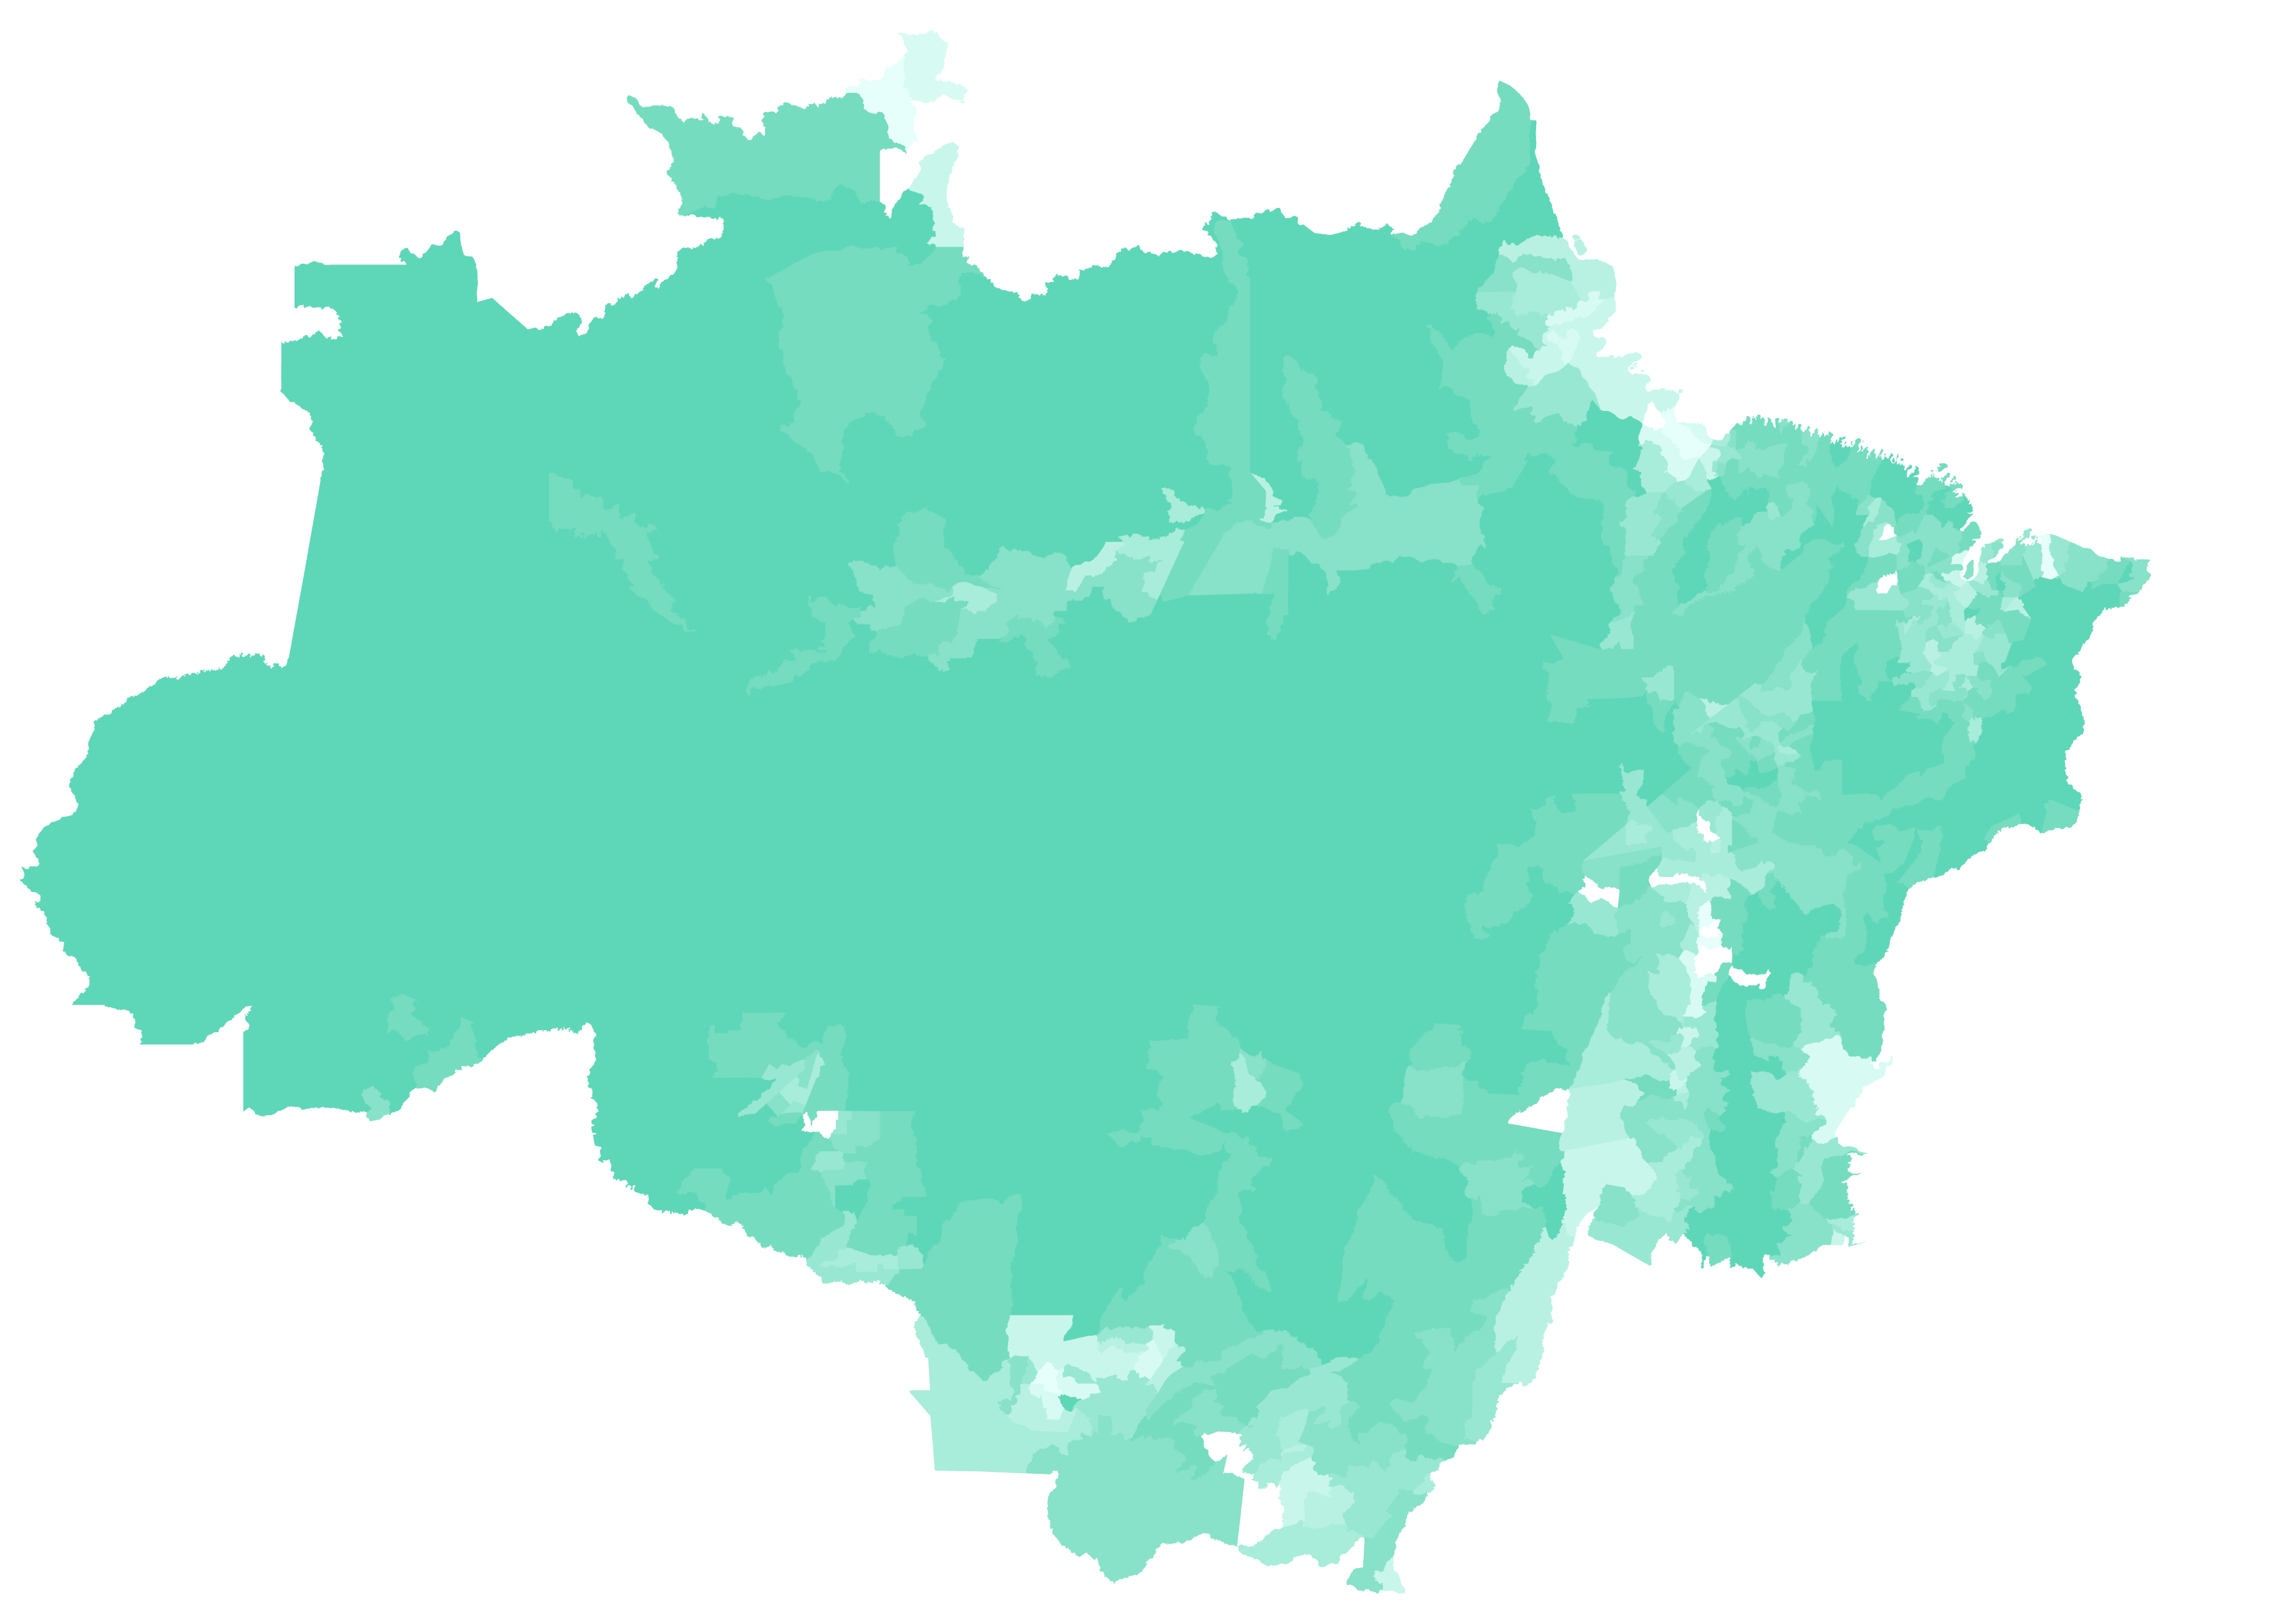
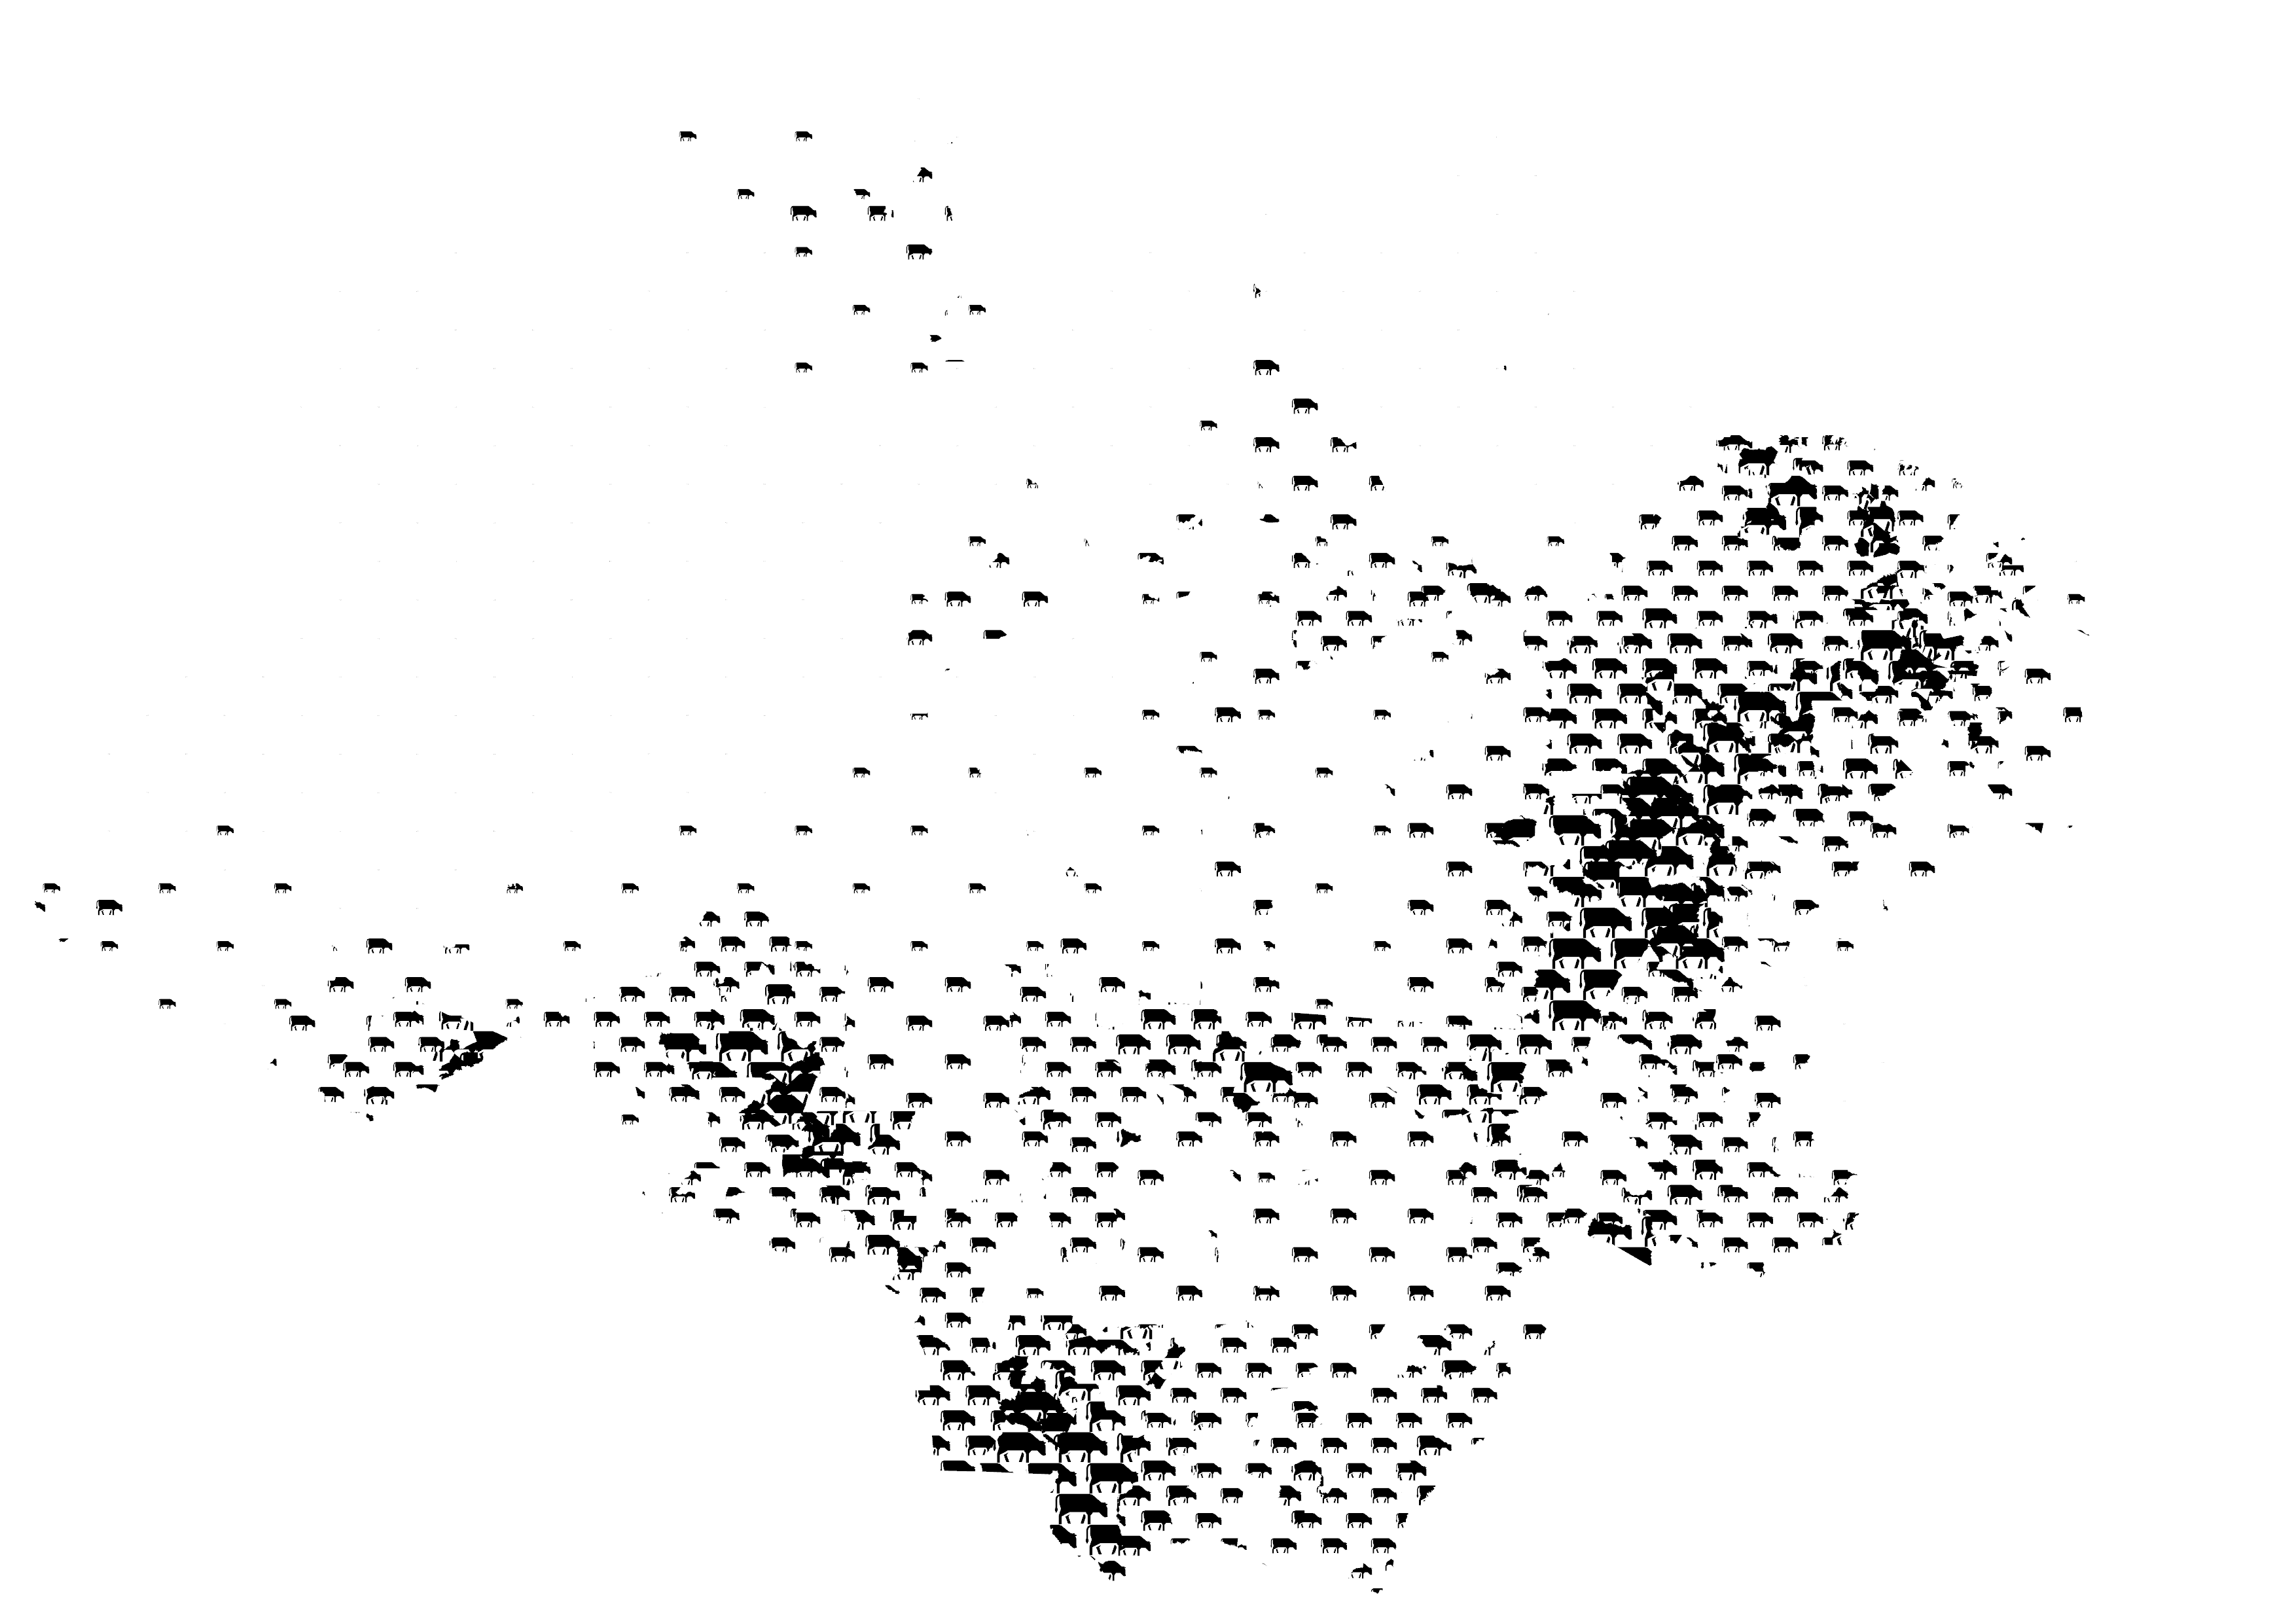
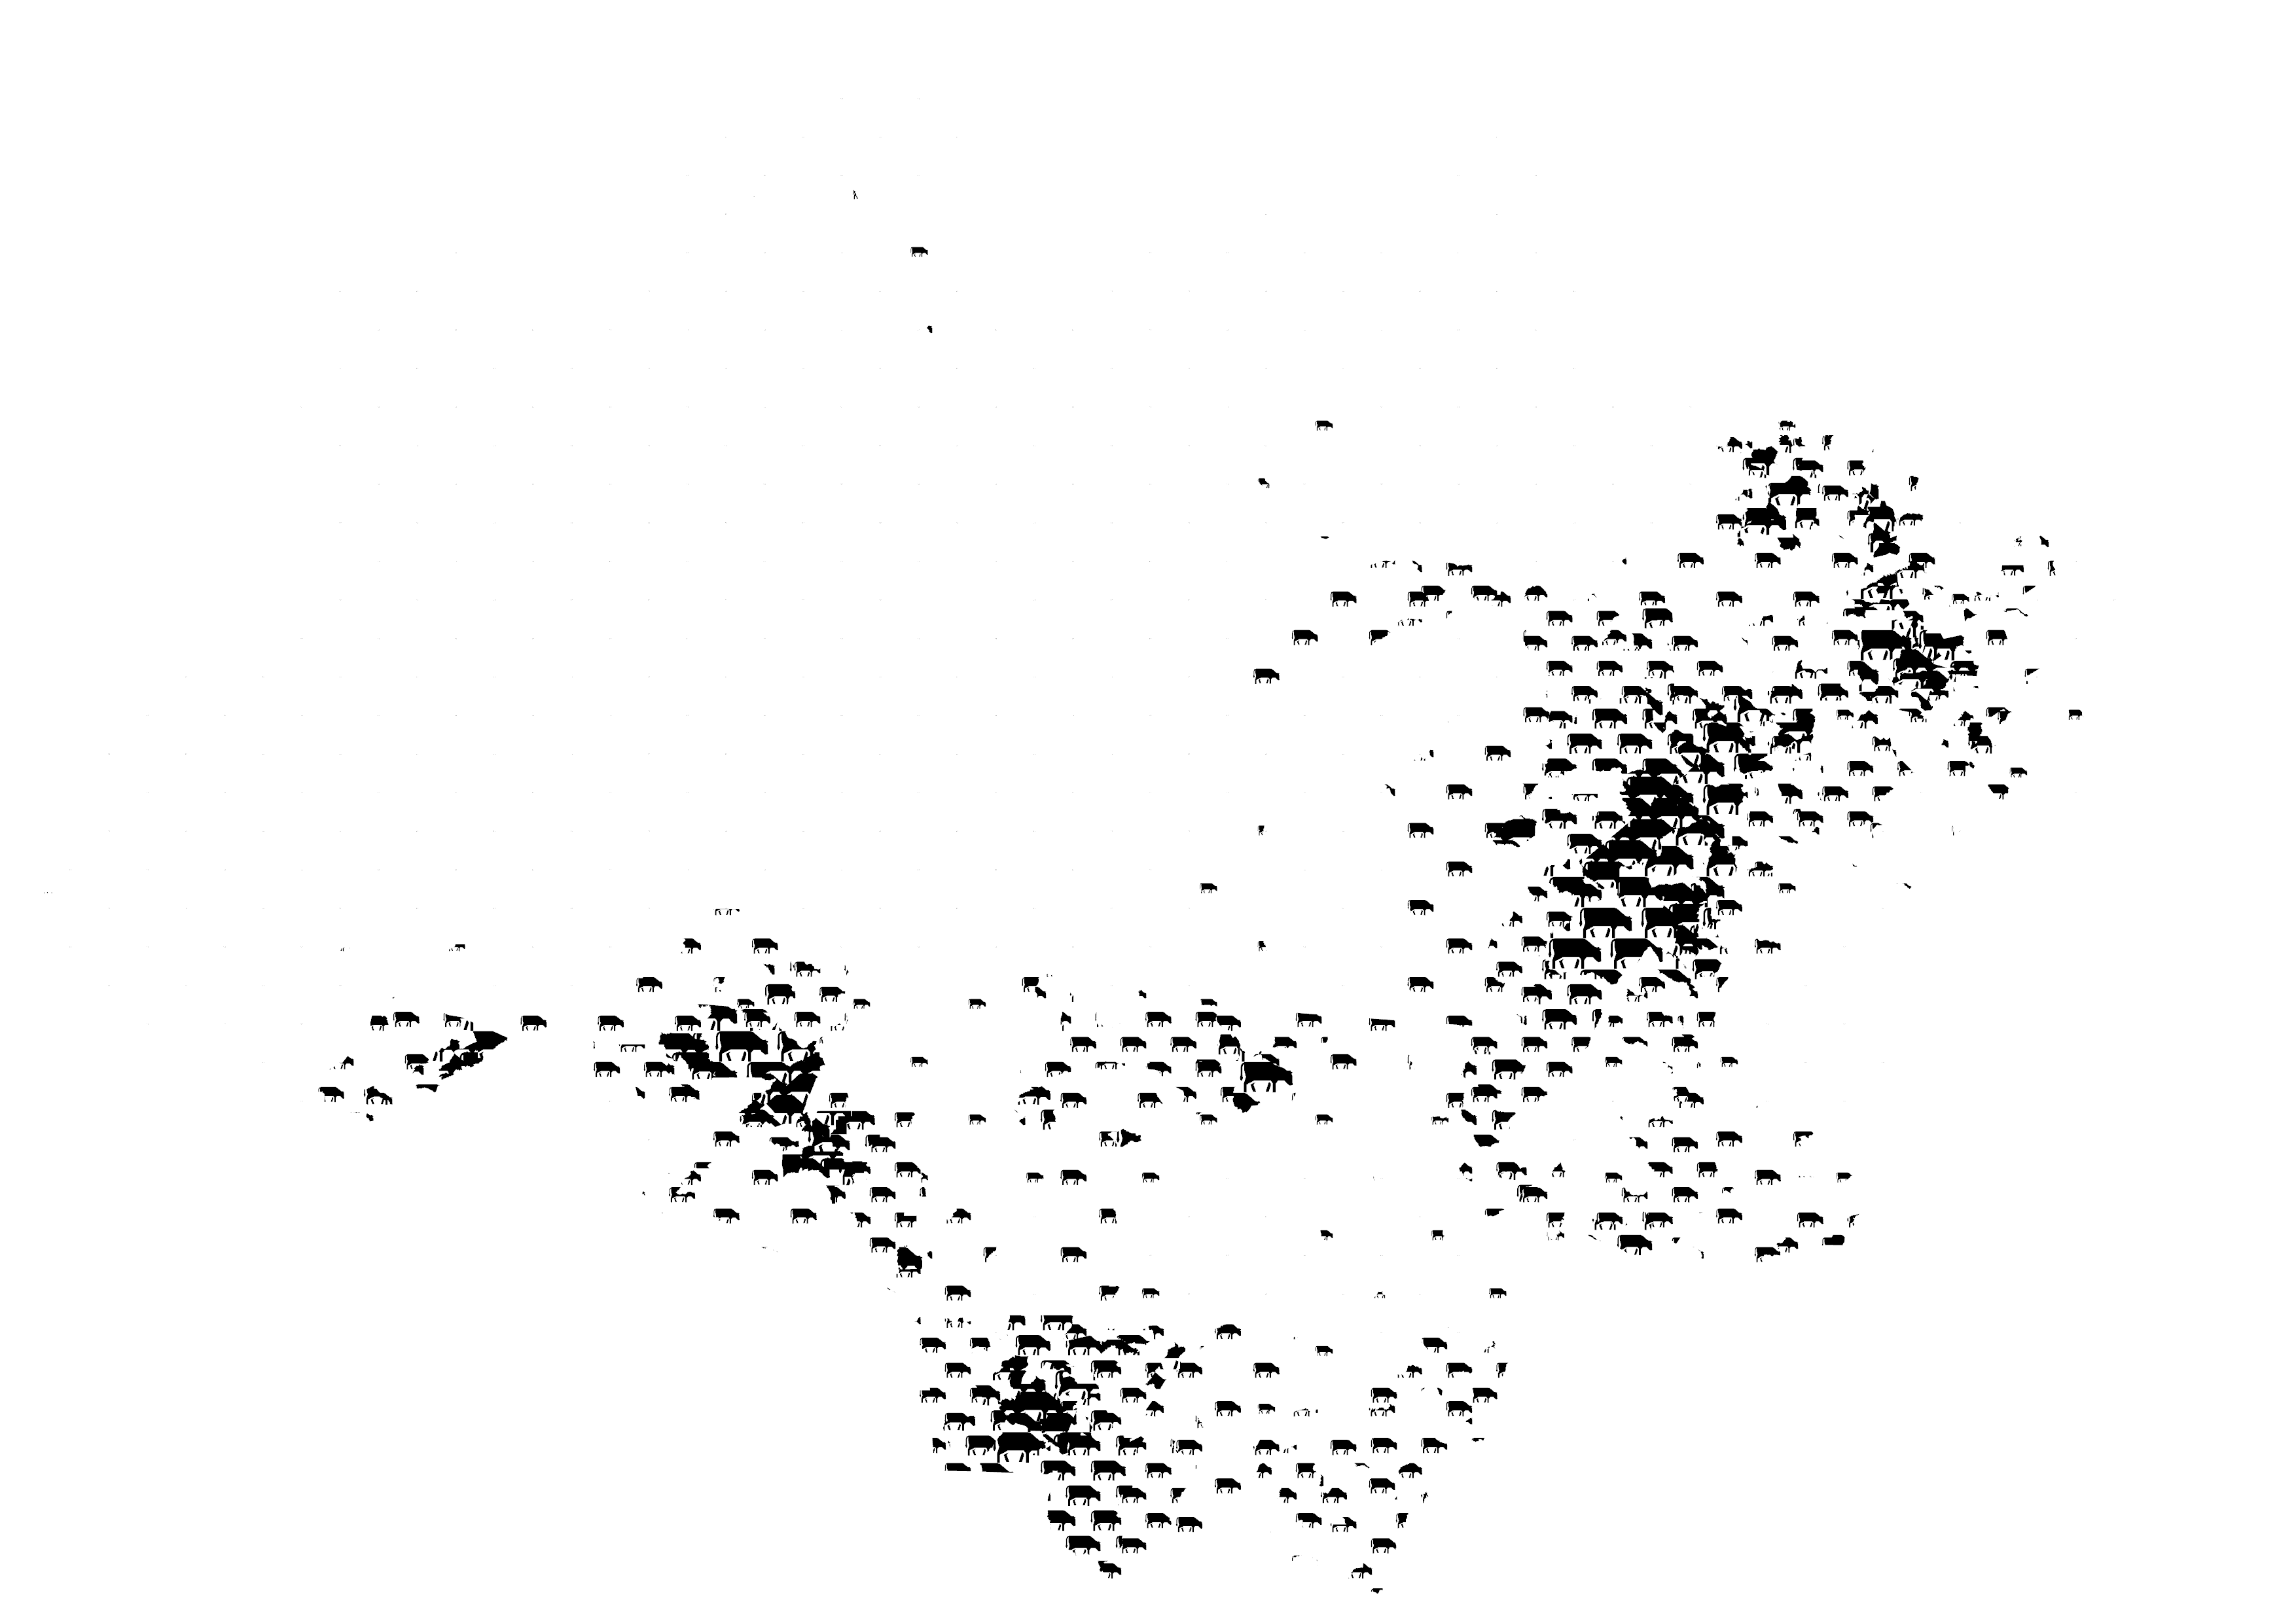
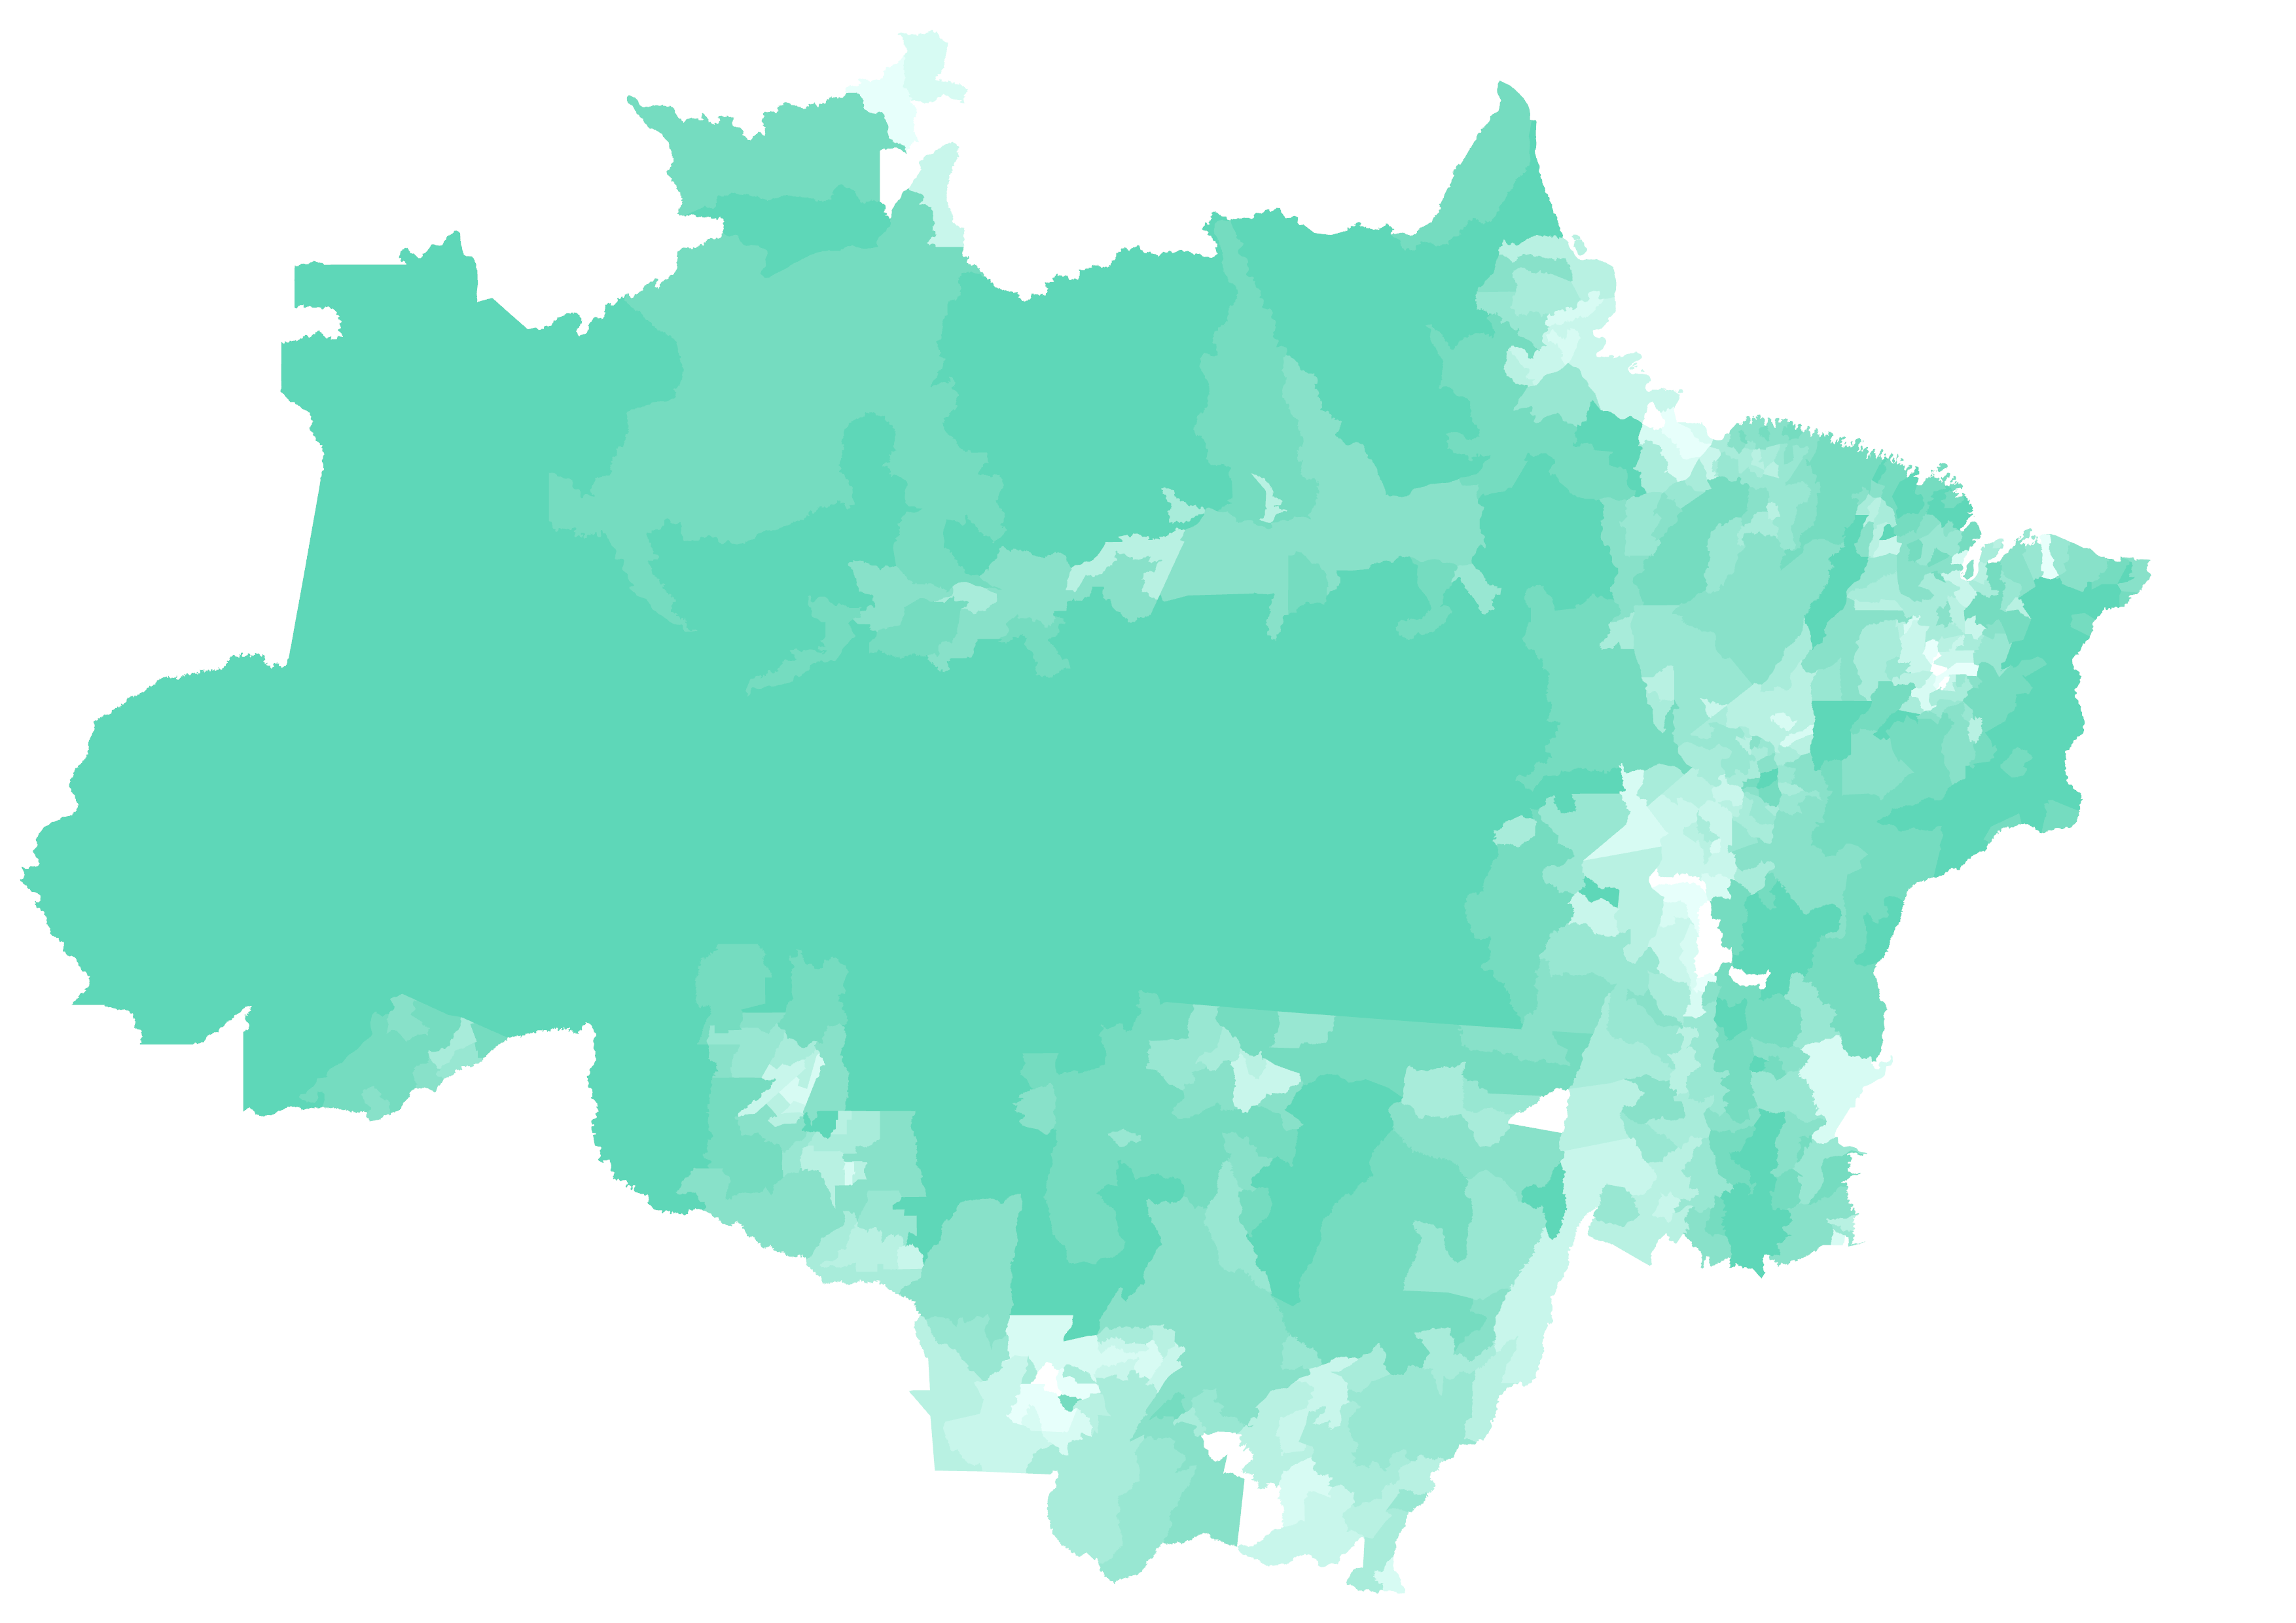
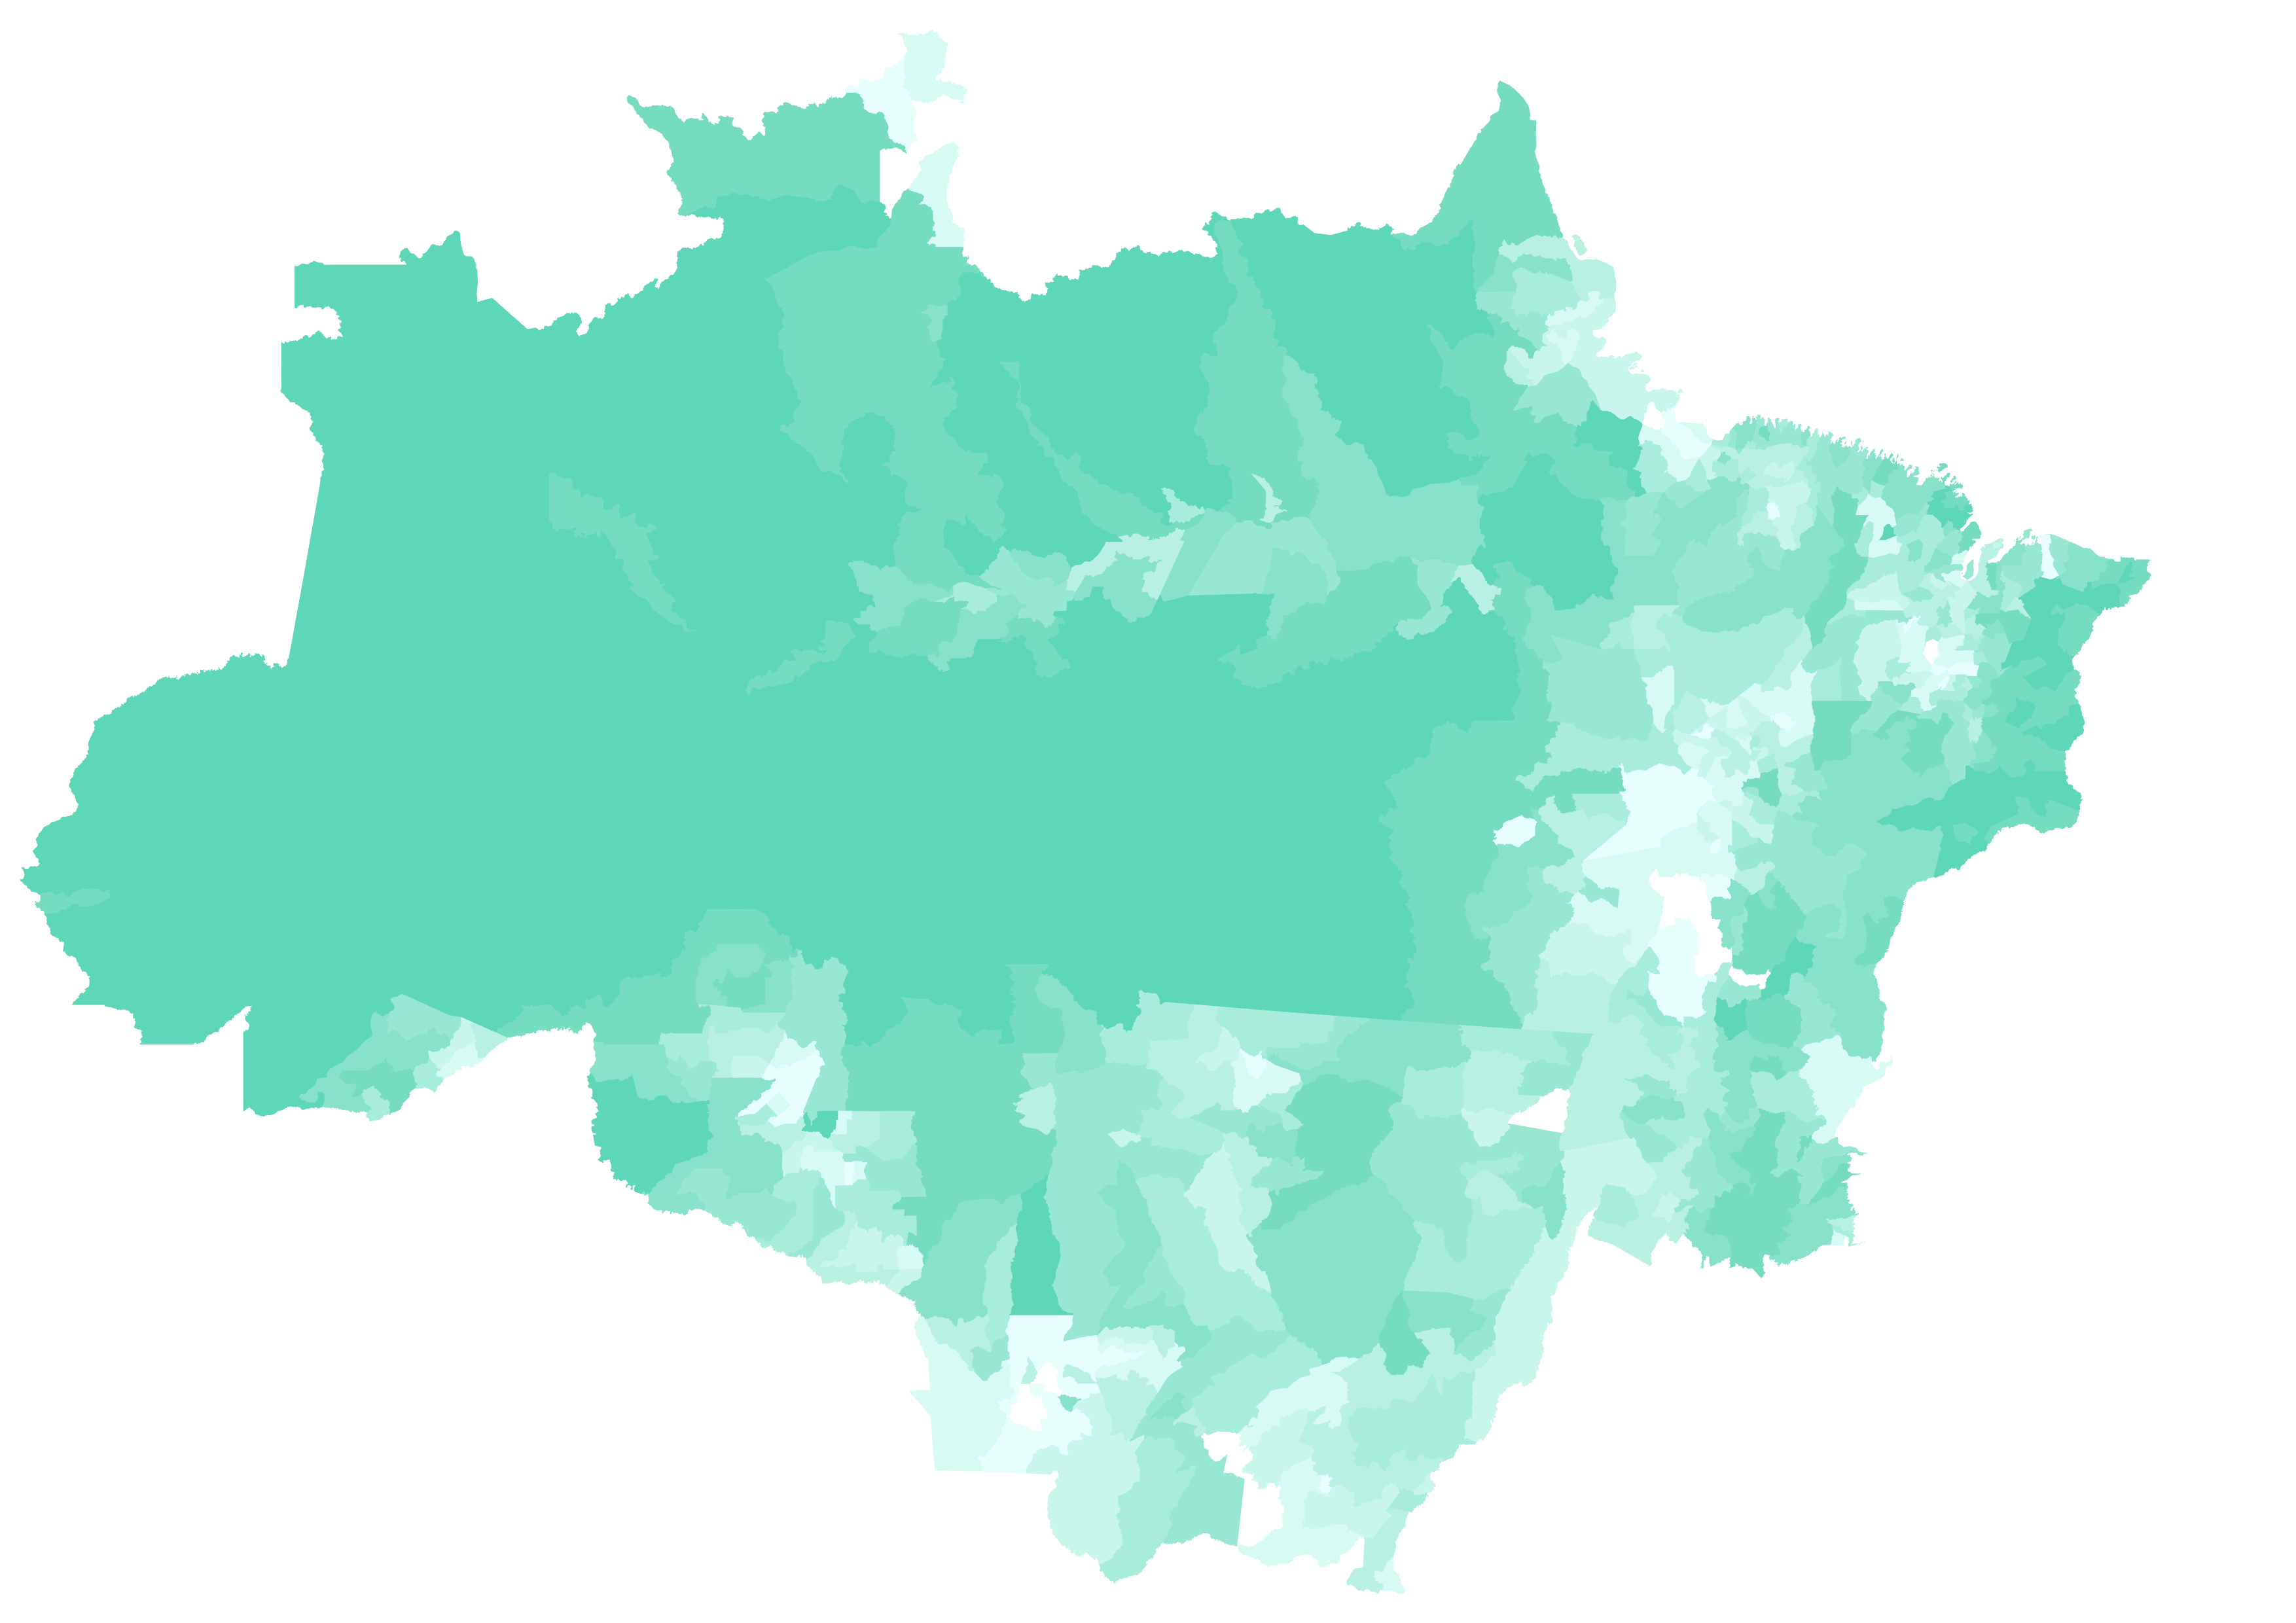
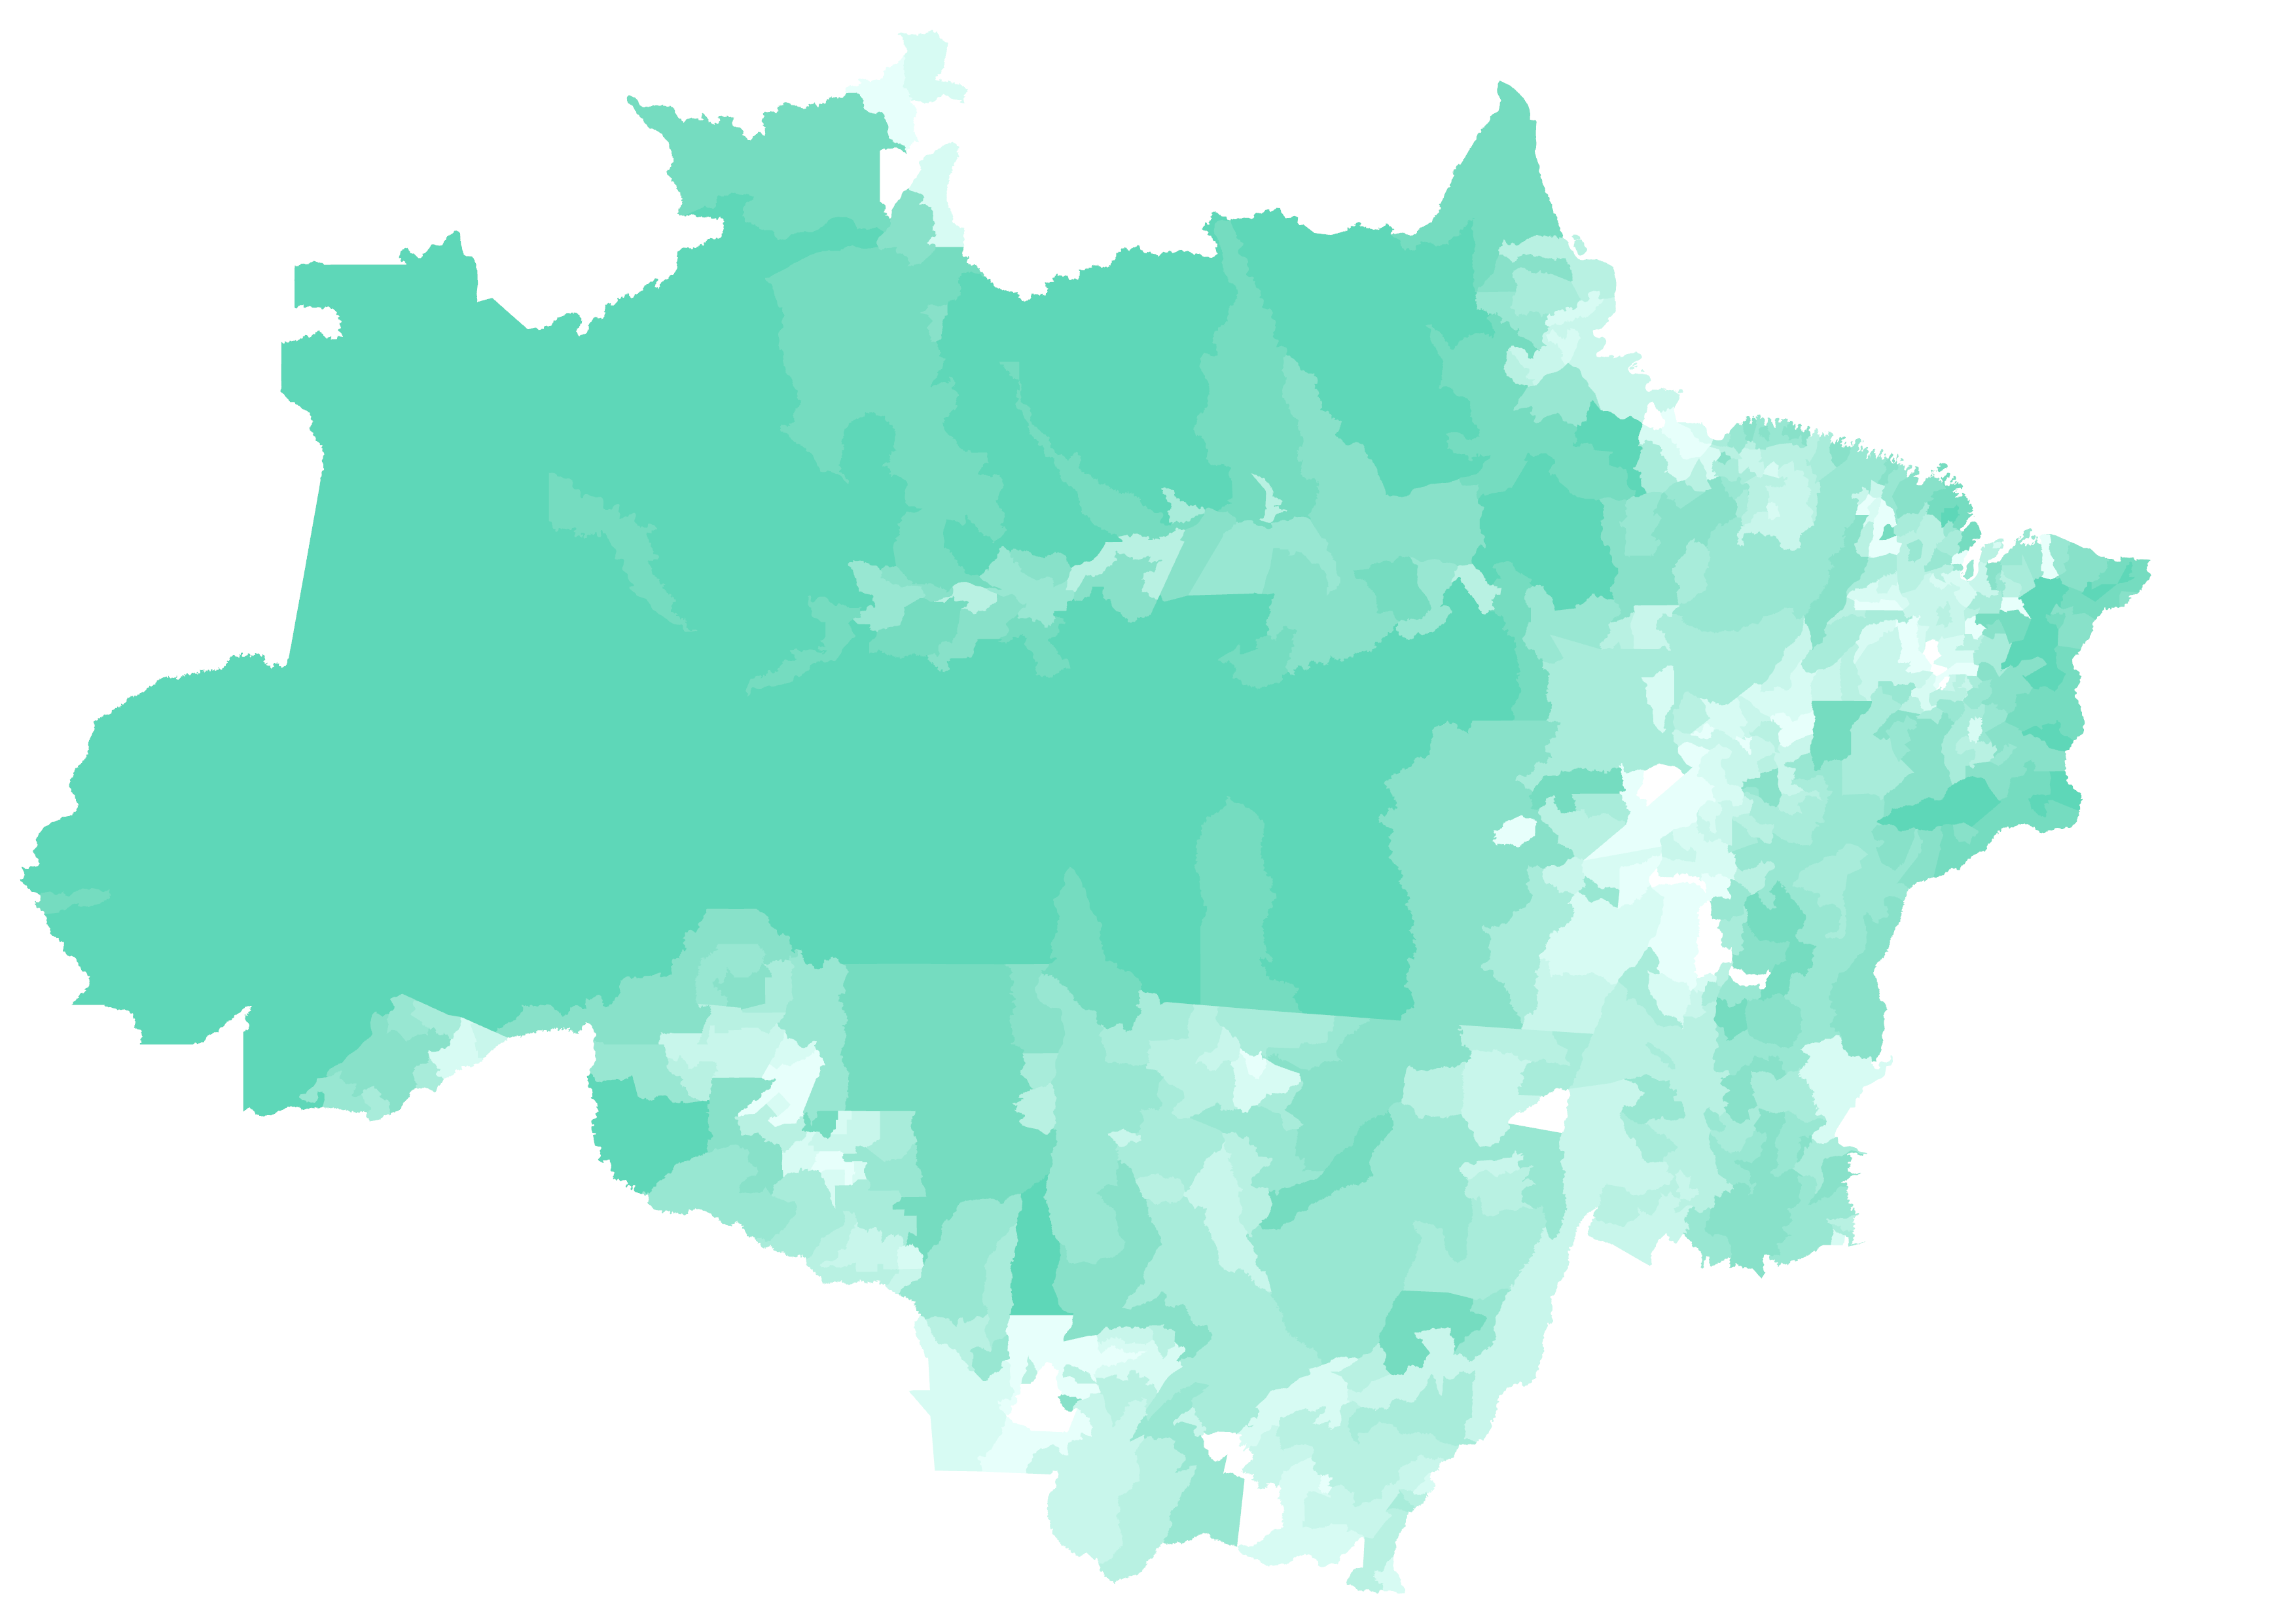
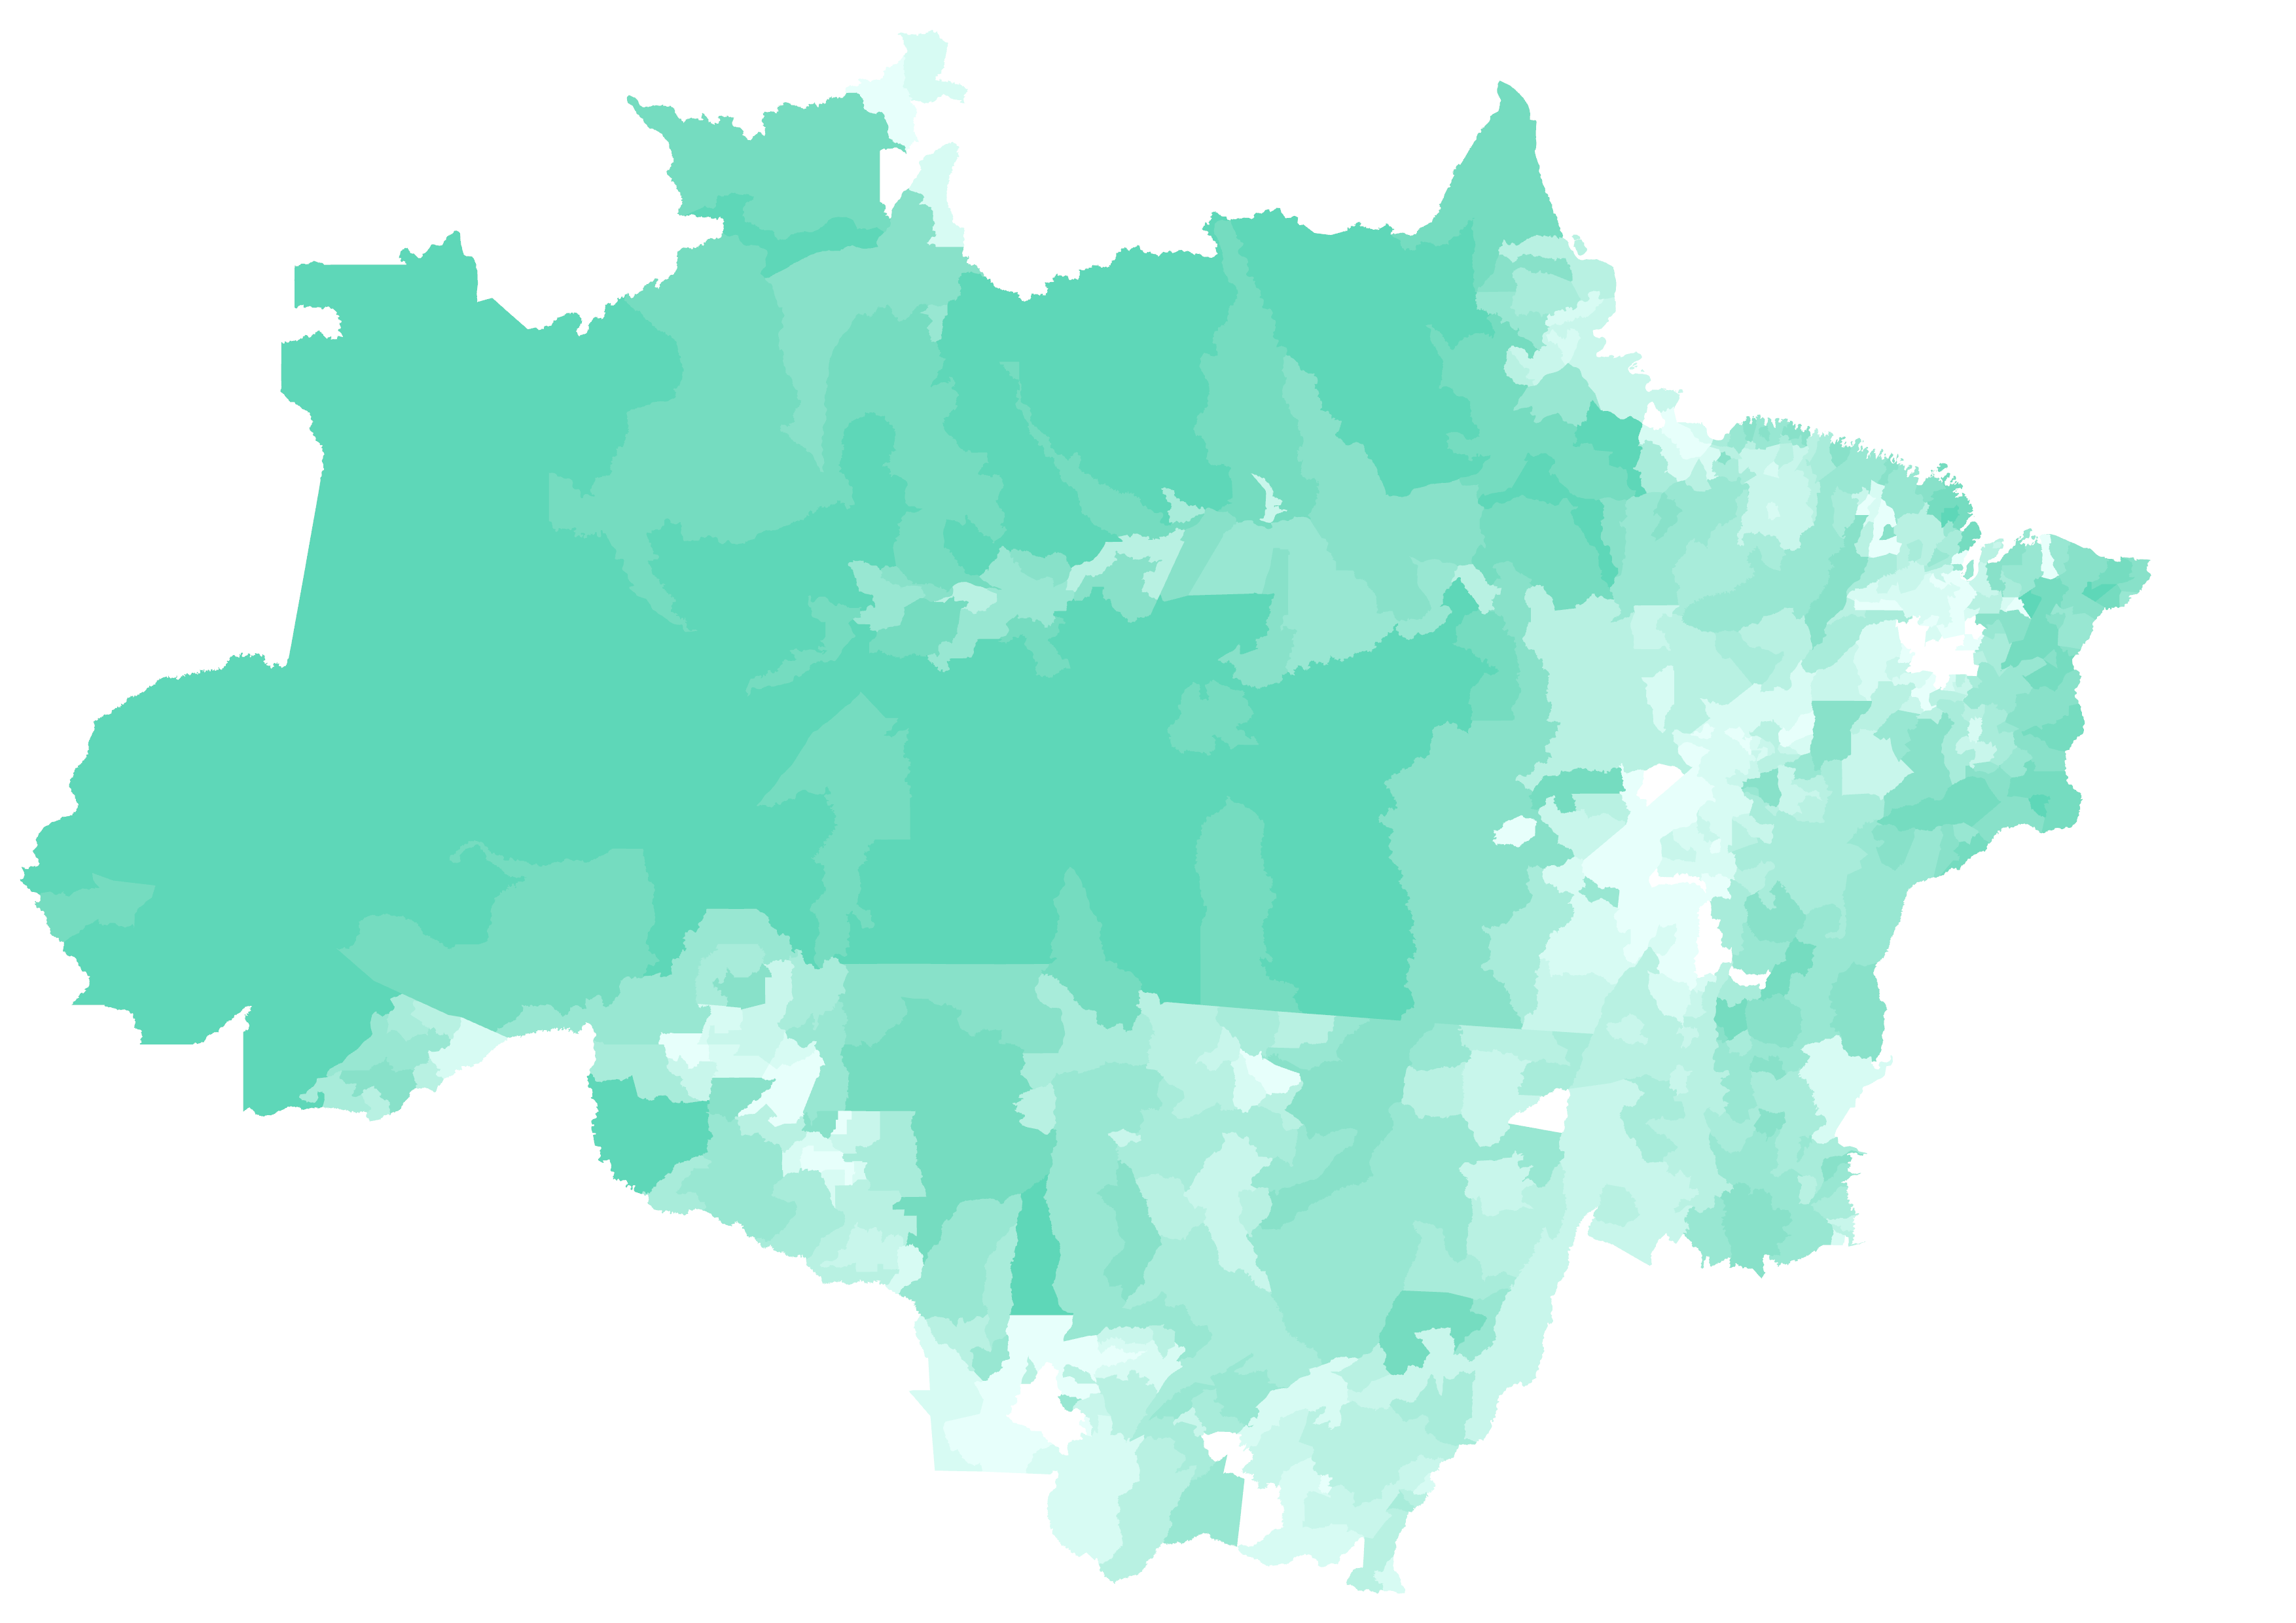
Two static views break the layers down further: the native forest gradient and the cattle pasture layer, shown here on their own rather than animated or combined. Isolated from the surrounding map and from each other, the shading and density of each are easier to study closely. The gradient tracking forest cover by municipality, the icon density tracking where pasture activity concentrates.